Debugging your pipeline
At this point, you have been introduced to all the essential building blocks of the modular software stack provided by the ASE framework. Specifically:
- You understand that the ASE software stack consists of many smaller services that communicate with each other
- You understand that services communicate in an output-only fashion, extracting and abstracting data for the next service in the pipeline to use
- You understand that the PUB-SUB communication pattern is used with an output-only design
- You understand how services publish and subscribe to data using ZeroMQ, including the benefits of ZeroMQ
- You understand how services serialize and parse data using Protobuf, including the benefits of Protobuf
- You understand how services know where to find each other (i.e. resolve their dependencies) for ZeroMQ communication using the SystemManager
- You understand that the SystemManager is the centralized service that knows everything about every service in a pipeline
There is one more essential advantage of using a microservice-based architecture together with a PUB-SUB communication pattern that we just briefly touched upon: there can be virtually unlimited subsrcibers to a service published outputs. If we know where all services publish their outputs (which we in fact do, thanks to the SystemManager), we can introduce a new service that secretly listens to all published outputs of all other services in a pipeline. This service can aggregrate all outputs and could then do many things with it, including:
- Logging all outputs to a text file on disk, for later reconstruction and debugging
- Forwarding all outputs to a server, to stream outputs over the network, for realtime debugging
At the ASE labs, we have developed exactly such a service, which we call the mod-Transceiver. A transceiver, because this service will not only forward output data to a server on the network for debugging, but can also receive requests from over the network (which can be used for OTA tuning, as we will discuss later).
Let's consider the power of the debugger by turning to our running example again. Below, execution of the example pipeline is visualized, together with the SystemManager (which should always be running) and communications highlighted:

Nothing new there, the SystemManager is the central authority on server registration and the way that services communicate adheres to the "output-only" way of doing things.
Now, let's add the DebugTransceiver and see how it "snoops on all busses" by secretly also subscribing to the output of all services:

Recall that the DebugTransceiver knows where these outputs can be found thanks to the SystemManager (this is another reason why it is prohibited to hardcode ZMQ addresses and circumvent the SystemManager in your code). Do also note that (using ZMQ PUB-SUB), output publishers do not know who is subscribed to their publications (this would not scale), so the DebugTransceiver is inherently invisble for services in the normal pipeline. This is by design, as we firmly believe that running a debugger should not alter program execution, and starting a debugger should be plug-and-play. Hence, there is no way for any service to know if the DebugTransceiver module is running (except for the SystemManager of course).
Even though the DebugTransceiver module should be invisible to other services, it is a process that runs on the Debix and consumes resources. In our testing, this did not noticeably affect performance but it is always good to keep in mind that your resources are limited.
Wrapping your messages
Before we'll discuss how you can actually use all provided debug information, we must first discuss a very important topic: message wrapping. Wrapping your Protobuf messages is vital to make debugging work (and it also helps your own software design). A basic wrapping schematic is shown below and discussed further afterwards:

Wrapping a message in another message helps all parts of a pipeline to understand which data it has received and how to parse it, specifically for Protobuf messages. Recall the following:
- Existence of properties in a Protobuf message is never enforced (i.e. every (nested) property of an object can be optional/null)
- Protobuf might encode two different messages to roughly the same binary format (over which you have no control) and will parse the smallest subset of objects successfully
Let's see what these two points mean in practice. Suppose the Camera module wants to output track edge data for the Controller module to read, as in our running example. The Camera service output data Protobuf schema is defined as follows:
// Generic coordinate object
message Coordinate {
    int64 x = 1;
    int64 y = 2;
}

message CameraOutput {
    // the "edges" property is an array of coordinates, representing the track edges
    repeated Coordinate edges = 1;
}
Now, the Controller service will output actuator data (basically steering commands), which are defined in Protobuf as follows:
message ControllerOutput {
    int32 steerPosition  = 1; // -1 means all the way left, 1 means all the way right
    int32 leftThrottle  = 2; // -1 is full speed reverse, 0 is brake, 1 is full speed forward
    int32 rightThrottle  = 3; // idem
}
Suppose now that the DebugTransceiver listens to both services' outputs and forwards them to a debugging visualization tool. It is the task of the visualization tool to correctly parse the Protobuf messages (encoded to binary format) and display them properly. How can the debugging visualization tool know how to parse any of these two messages correctly, if they come in over the same output?
Simply put, it can not. Let's explore why this is the case:
- The debug visualizer receives a forwarded
CameraOutputfrom the DebugTransceiver - It tries to parse this
CameraOutputasControllerOutput. This works, since rule (2) holds. Protobuf parses the message but deems all values of theControllerOutputscheme optional.
In this case, it could try to parse any incoming messages as all sensor output formats it knows (i.e., try to parse as CameraOutput after) and keep going until a non-null field has been encountered. But this has several drawbacks:
- Depending on the hot code path, this might take longer as it will try to parse a message as all possible message formats
- It will become more cumbersome to write the parsing logic for this, especially as you define more serice outputs throughout your code
- It is not a definitive solution: as some message schemas might share properties (such as a timestamp). Protobuf will parse these shared fields as non-null according to rule (2), although this might not be the message schema that was originally used to send
Esentially, you have one communication channel on which you can receive multiple encoded messages, and you do not know how to confirm that you decoded any received message to its correct schema again, since the decoder is too lenient.
The preferred way to solve this, is by using message wrappers and oneof types using Protobuf. oneof types can seen as definitive switch statements, that tell you exactly which schema was used to encode a message. Then, you should by convention only send wrapper messages over your communication channel and use oneof parsing to decode which message was sent. Let's see this in action for our example so far.
First, we introduce the wrapper message schema definition, which allows us to send either CameraOutput or ControllerOutput:
message GenericOutput = {
    int64 timestamp = 1;
    // The oneof directive tells the parser that property "sensorOutput" is one of the following types: CameraOutput OR ControllerOutput
    oneof sensorOutput = {
        CameraOutput cameraOutput = 2;
        ControllerOutput controllerOutput = 2;
    }
}
When parsing in the programming language of your choice, you can use the corresponding oneof parsing mechanic (probably a switch) statement to get the correct message type. In our example, this means that the debug visualization tool can just parse every incoming message as GenericOutput and use the oneof field to determine the actual contents. As an added benefit, reused fields can be extracted to the wrapper message (like timestamp in this case) to keep your message definitions DRY.
In the ASE software framework, all service outputs are wrapped and oneof'd to make parsing outputs a breeze. The message definitions to do this are public and already packaged to C, Golang and TypeScript so that you can easily integrate them into your code. Below the wrapping steps and corresponding message schemas are listed. They are in accordance with the illustration at the start of this section.
- Any module creates an output, like the Controller service creating actuator data. (See ASE schema). The module itself wraps this in a generic schema with all possible outputs so that any subscriber can parse the message as SensorOutput. Also timestamp information is added (to impose an ordering on sensor output processing) and a sensor status is added (to allow for sensor crash reporting and recovery). (See ASE wrapper schema)
- The DebugTransceiver fetches the module outputs, does not decode them, but wraps their raw bytes into a message with added debug information (See ASE schema)
With this in mind, each module can parse the output of any module easily and debug visualization (or reconstruction) tools have all the debug information they might need.
The observant reader might have noticed that the SensorOutput wrapper message also contains a sensorId field. This implies that a service might have multiple sensors which all can create outputs. This is indeed the case and is supported by the ASE framework but this is an advanced use case. Getting started, it is recommended to set the sensorId field to 1 (or any fixed number) when serializing the wrapper sensorOutput message.
Leaving the Debix for realtime debugging
At the ASE labs, we found that debugging is most useful if debug information can be shown and visualized (almost) realtime. This includes viewing camera livestreams, showing sensor output values and charting controller PID values. We have developed two essential pieces of software to make this happen: the util-ForwardingServer component and the util-WebController component. Both will be discussed in detail in this section.
Let's first recall how debug information (sensor outputs) might leave the Debix through the DebugTransceiver. This is the first time that we consider any other place to run your software than on the Debix. Remember: any service with the mod- prefix is expected to run on the Debix, for any other software tool you should understand from its context where it should run.
The debug information will be sent to a central forwarding server (util-ForwardingServer), which is reachable over the network (for minimal latency, having the server running on LAN is preferred). The forwarding server will then forward and distribute the data to all connected debug visualization tools (which we call util-WebControllers). This is visualized below.

In the illustration above, connections between the DebugTransceiver, ForwardingServer and WebController instances are shown in orange, denoting that they use WebRTC instead of ZeroMQ. There is no need to understand how WebRTC works and you do not have to incorporate WebRTC into your project. Though, it is good to understand that this is a different communication protocol than ZeroMQ, used when realtime communication is preferred, instead of reliable communication (as is the case with ZeroMQ). This is comparable to the differences between UDP and TCP.
From the illustration above, the main takeaway should be how data flows are routed to leave the Debix and what the role of util-ForwardingServer is.
The forwarding server exposes a HTTP server that can be used by (1) the debix (obviously) and (2) any client that is interested in listening to the debug information output by modules on the debix. Using the exposed HTTP endpoints, a WebRTC connection is set up for realtime communication. (This is the de facto standard in browser-land). When one or more clients are connected, the forwarding server will essentially duplicate the incoming debug information from the debix and send it to all connected debug visualization clients. Take moment to understand that the incoming debug information from the debix is aggregated by the mod-DebugTransceiver, which will send it off to the forwarding server.
Visualizing debug information using util-WebController
Finally, we have come to the end (and arguably most important part) of the debug information flow: actually visualizing the debug information that was forwarded by the forwarding server. At the ASE labs, we have developed a utility for this so that you can get started debugging right away. It is called the util-WebController.
Adding everything together: debugging a real pipeline
To see the power of the mod-DebugTransceiver, util-ForwardingServer and util-WebController, we will run a basic pipeline consisting of two dummy sensors (A and B), where sensor B depends on sensor A. Both dummy sensors will output speed sensor data according to the ASE speed sensor output spec. (The schema definition is very simple and worth a look). This section is also your first introduction to actually running services provided by the ASE software framework.
The RPM values outputted by both dummy sensors are calculated using the following pseudocode:
rpm_output = 0
while true:
    rpm_output += 1
    rpm_output = rpm_output % 100 # wrap around to 0 after reaching 100
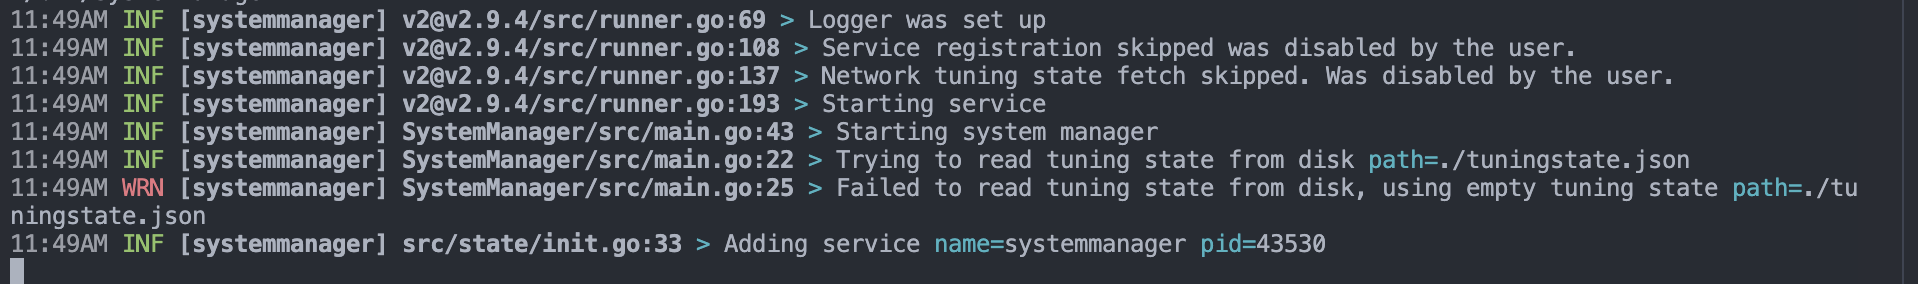
First (as should always be the case), we will start the SystemManager on the debix, so that both dummy sensors can register themselves. The output should look similar to this:
Then, we will start both dummy sensors. To show that the SystemManager imposes the dependency graph order, let's try to start dummy sensor B (which depends on sensor A) first. The output of dummy B should look similar to the following:
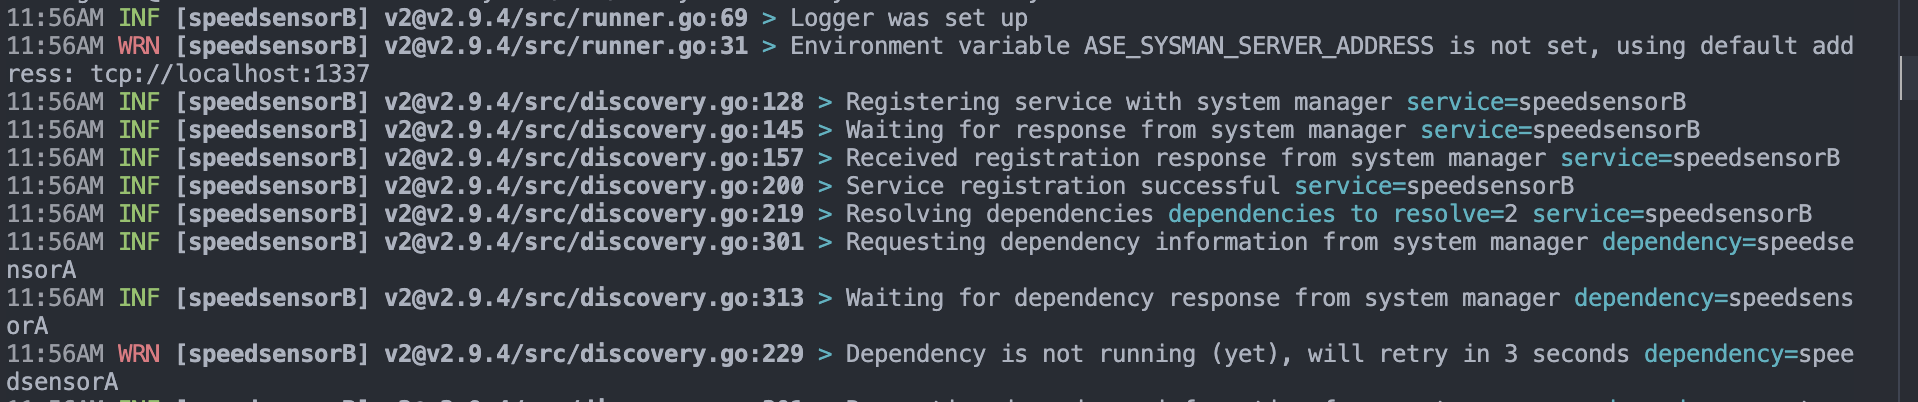
Notice the eror message which indicates that dummy service B cannot start yet, since its dependency service A is not running yet. This is desired behavior, and as soon as we start Service A as well, service B will start running:
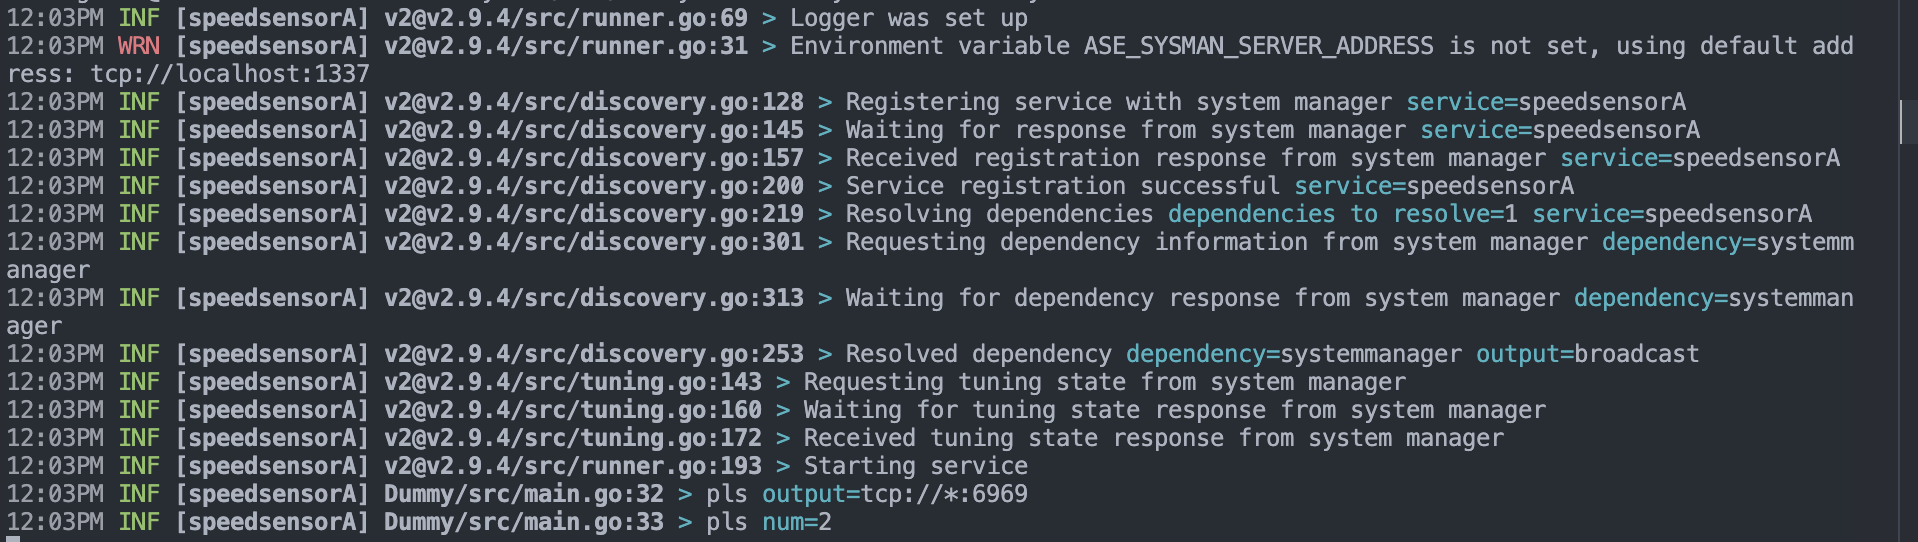
Output of service A:
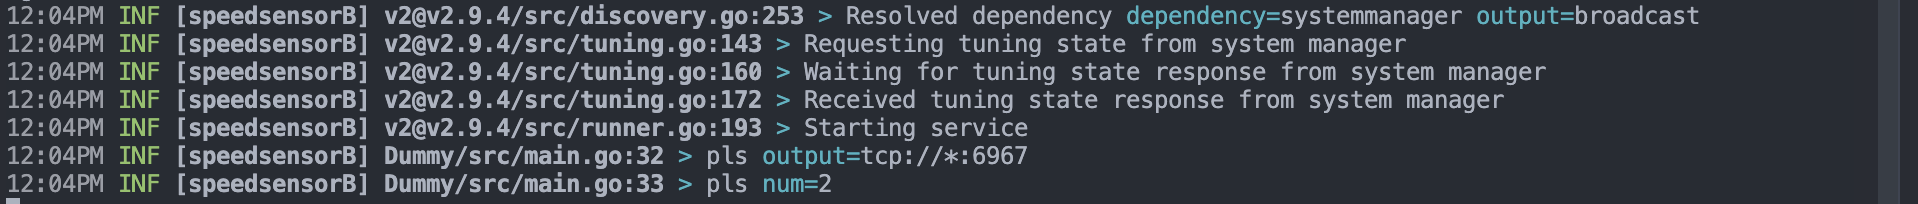
Output of service B:
Great, so our basic pipeline is running now. Let's start the ForwardingServer so that we can view and visualize debugging information in the browser. The ForwardingServer will by default listen on localhost:7500:
As explained before, the ForwardingServer should not run on the debix, but on hardware that is reachable over the network (most likely, this will be your laptop, which should be connected to the same local network as your debix).
Then, we will start the Transceiver, which (as you should know by now) will scan all published outputs and subscribes to all of them to aggregrate debug information. The DebugTransceiver has a service.yaml file definition in which you can define how it can connect to the ForwardingServer, the configuration for connecting to the ForwardingServer on localhost is shown below:
# Service definition
name: debugtransceiver
description: Aggregrates debug information and sends it to the ForwardingServer

# No dependencies at start
dependencies: []

# No outputs
outputs: []

options:
 - name: forwardingserver-address
   type: string
   mutable: false
   default: http://localhost:7500
Run the DebugTransceiver (on the Debix) after modifying your service.yaml as needed and then start up the WebController as explained here. Visit localhost:5173 and start debugging your pipeline!
The debugger is still experimental and not all features are fully supported yet in all browsers. For the best experience, please use Google Chrome when opening the debugger.
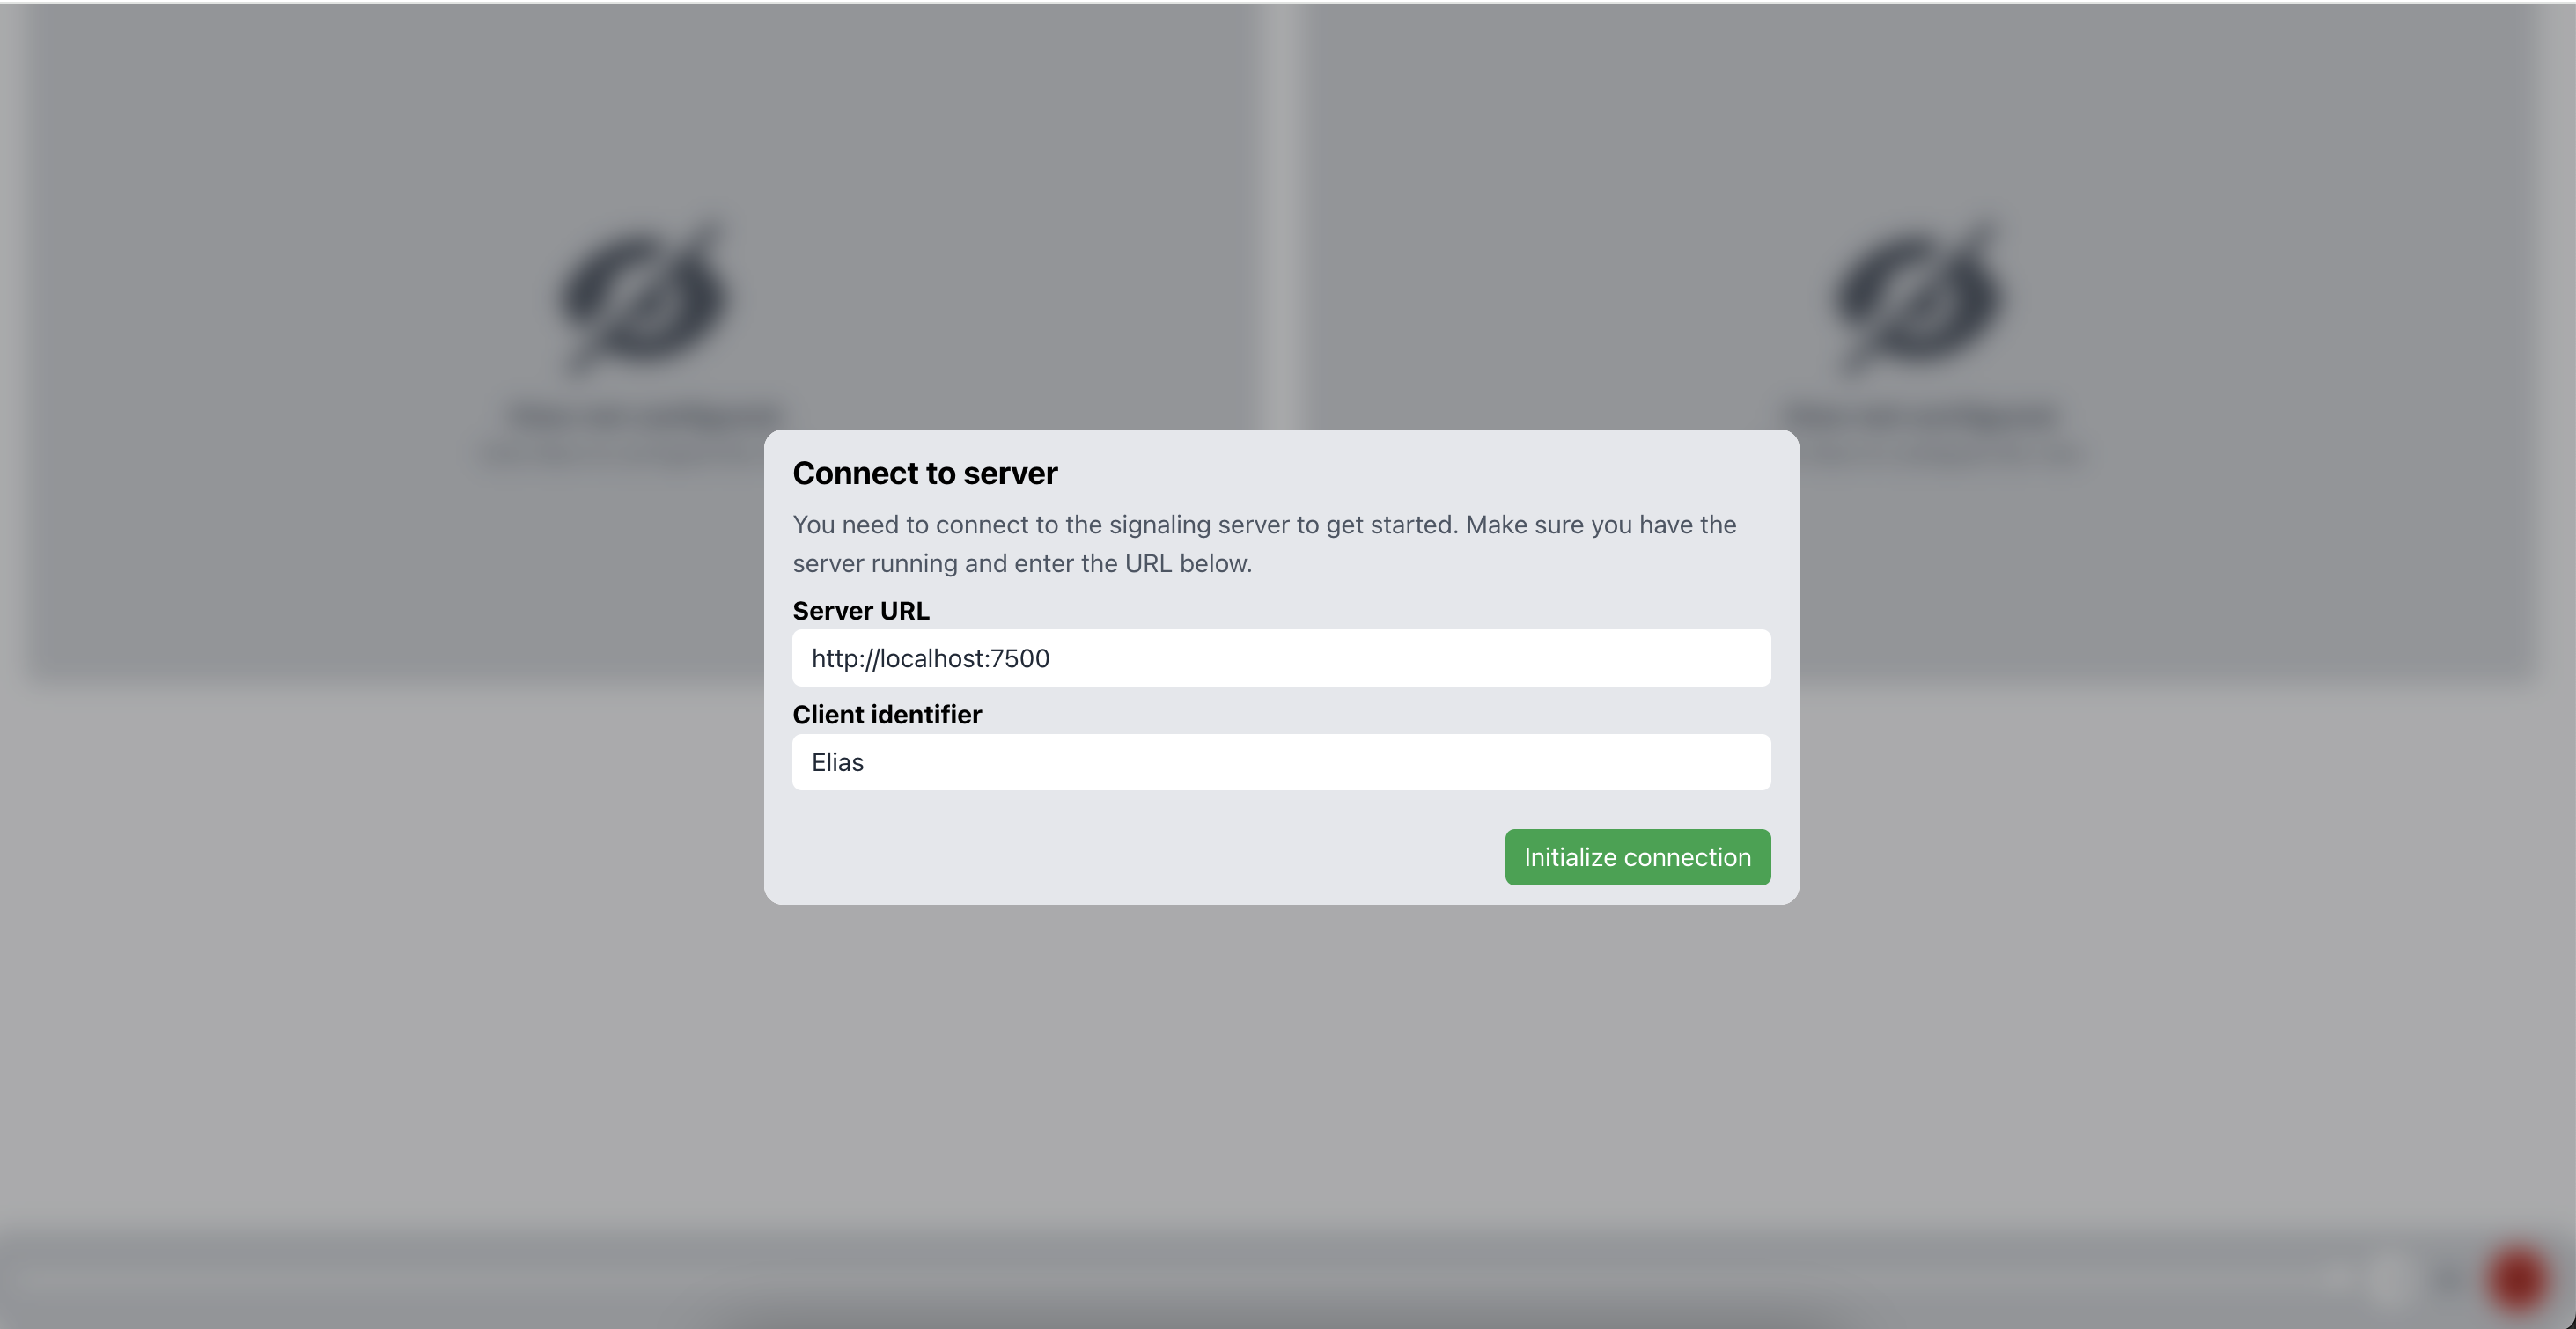
When the application loads, enter the forwarding server information to connect to your forwarding server of choice. You can add an identifier so that you avoid registering duplicate debugging clients:
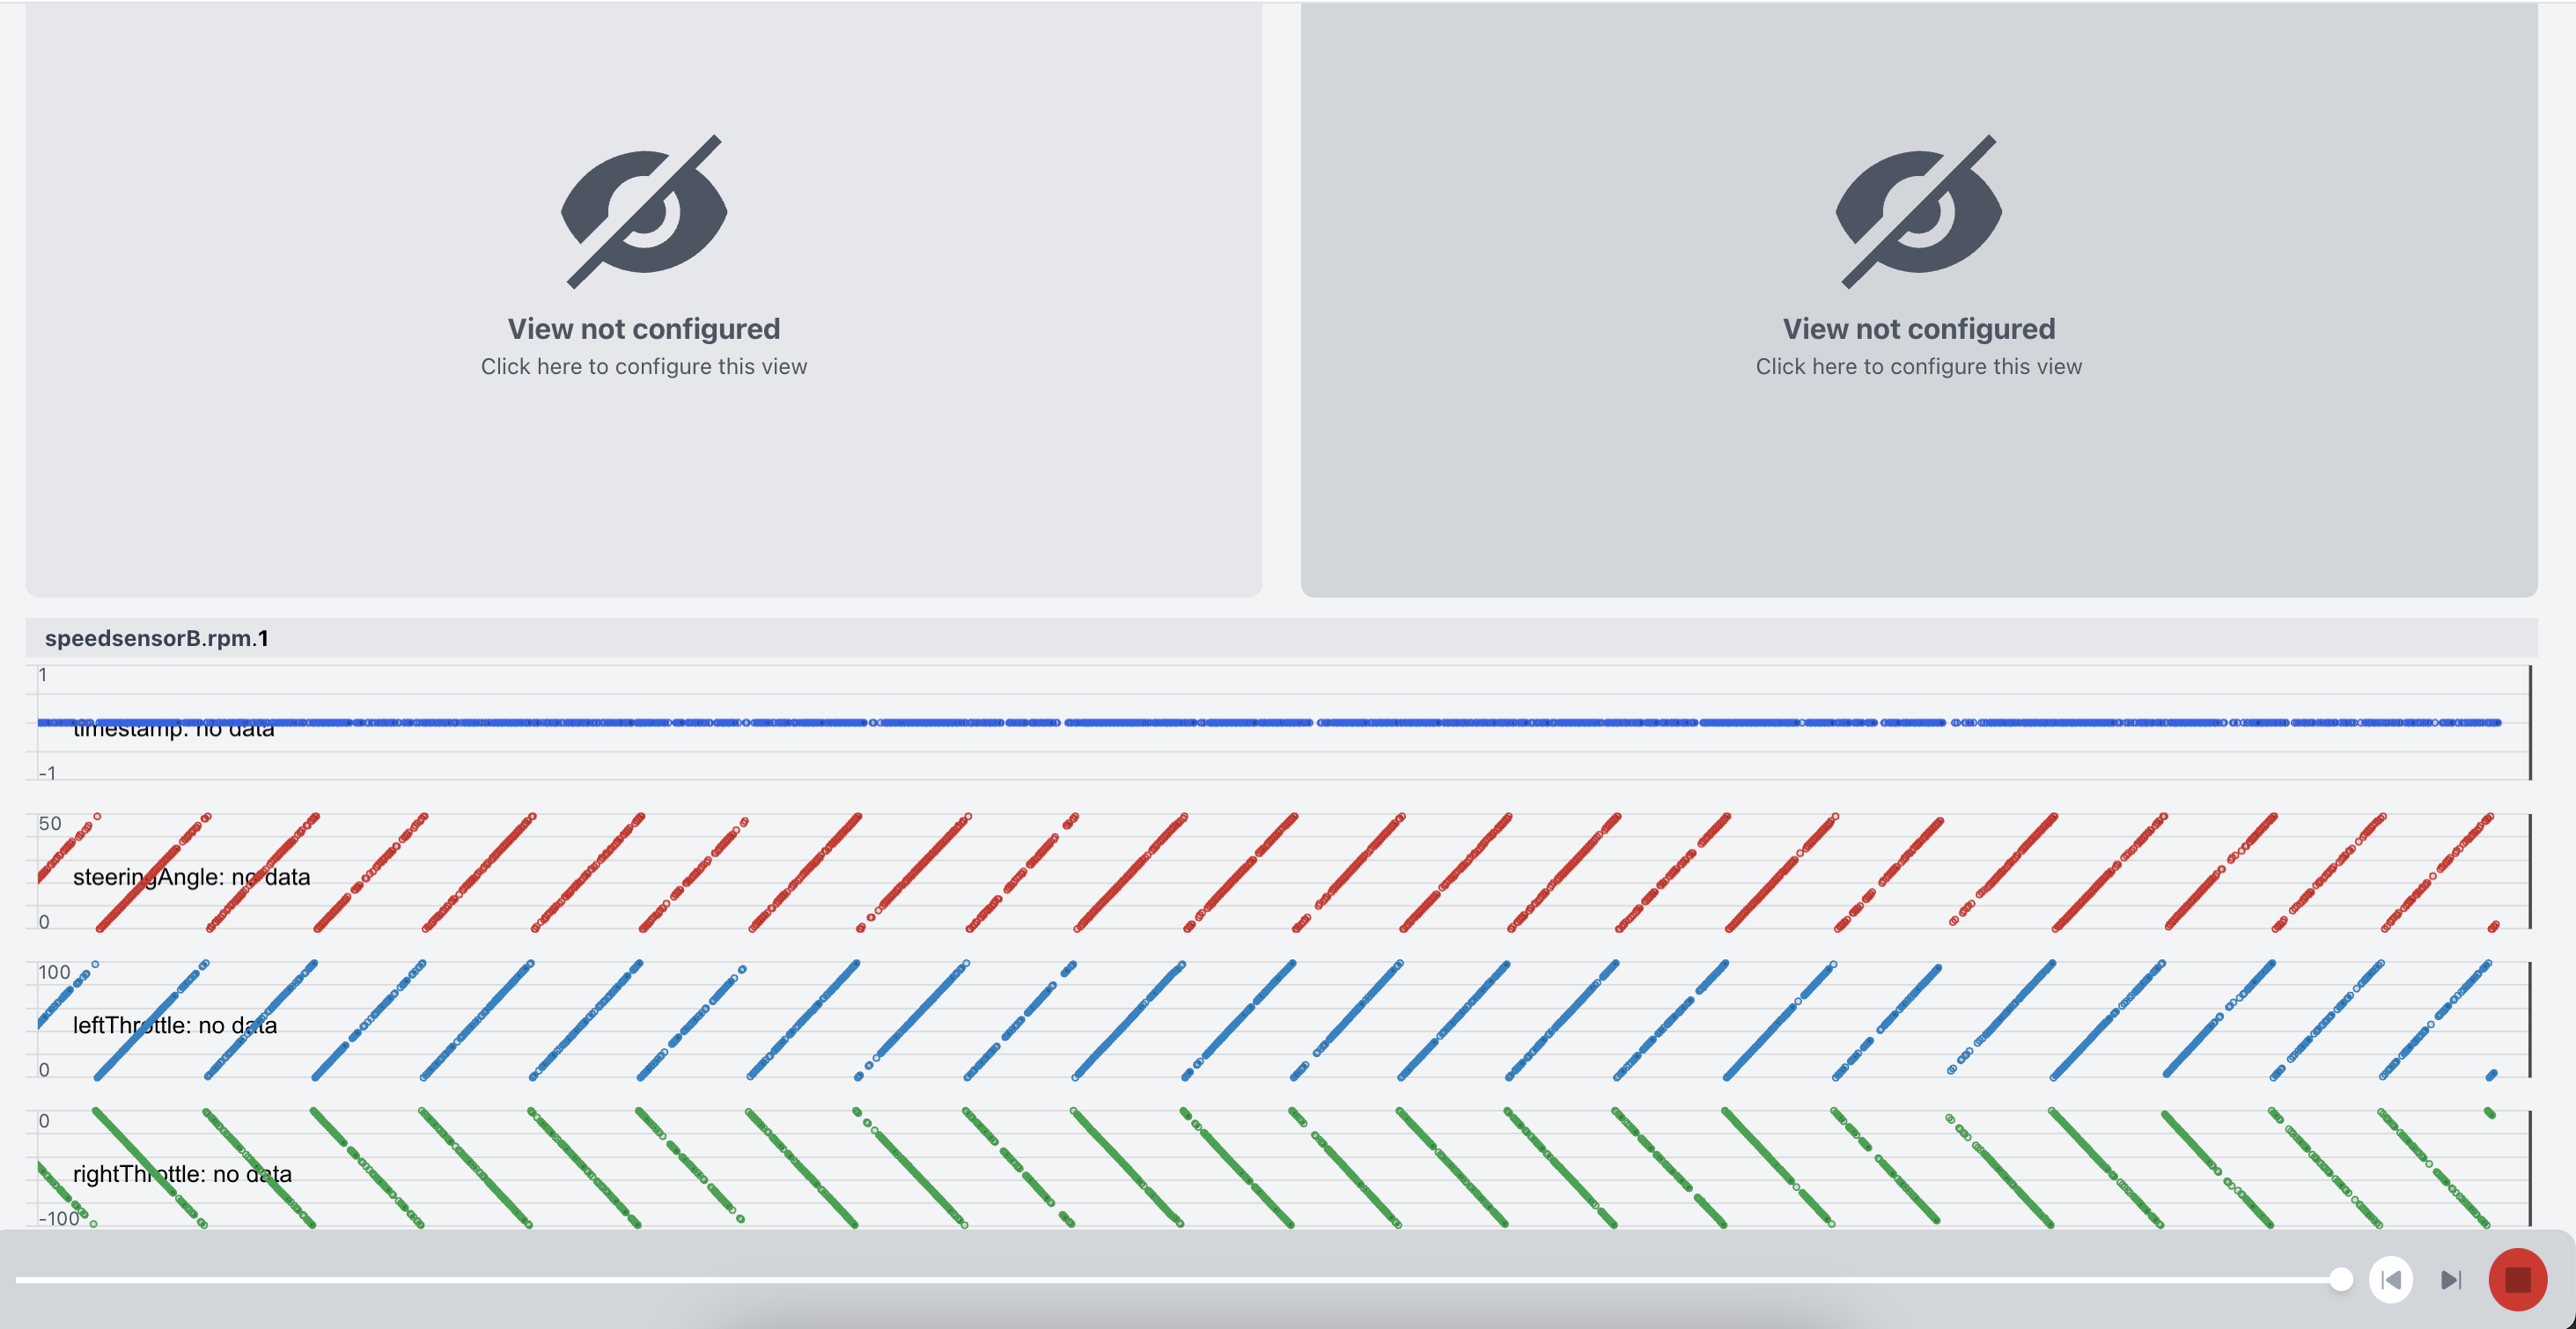
After entering the correct information and connecting, data should be flowing in automatically. Quantifiable data will be charted and you can scroll the chart to view all services:
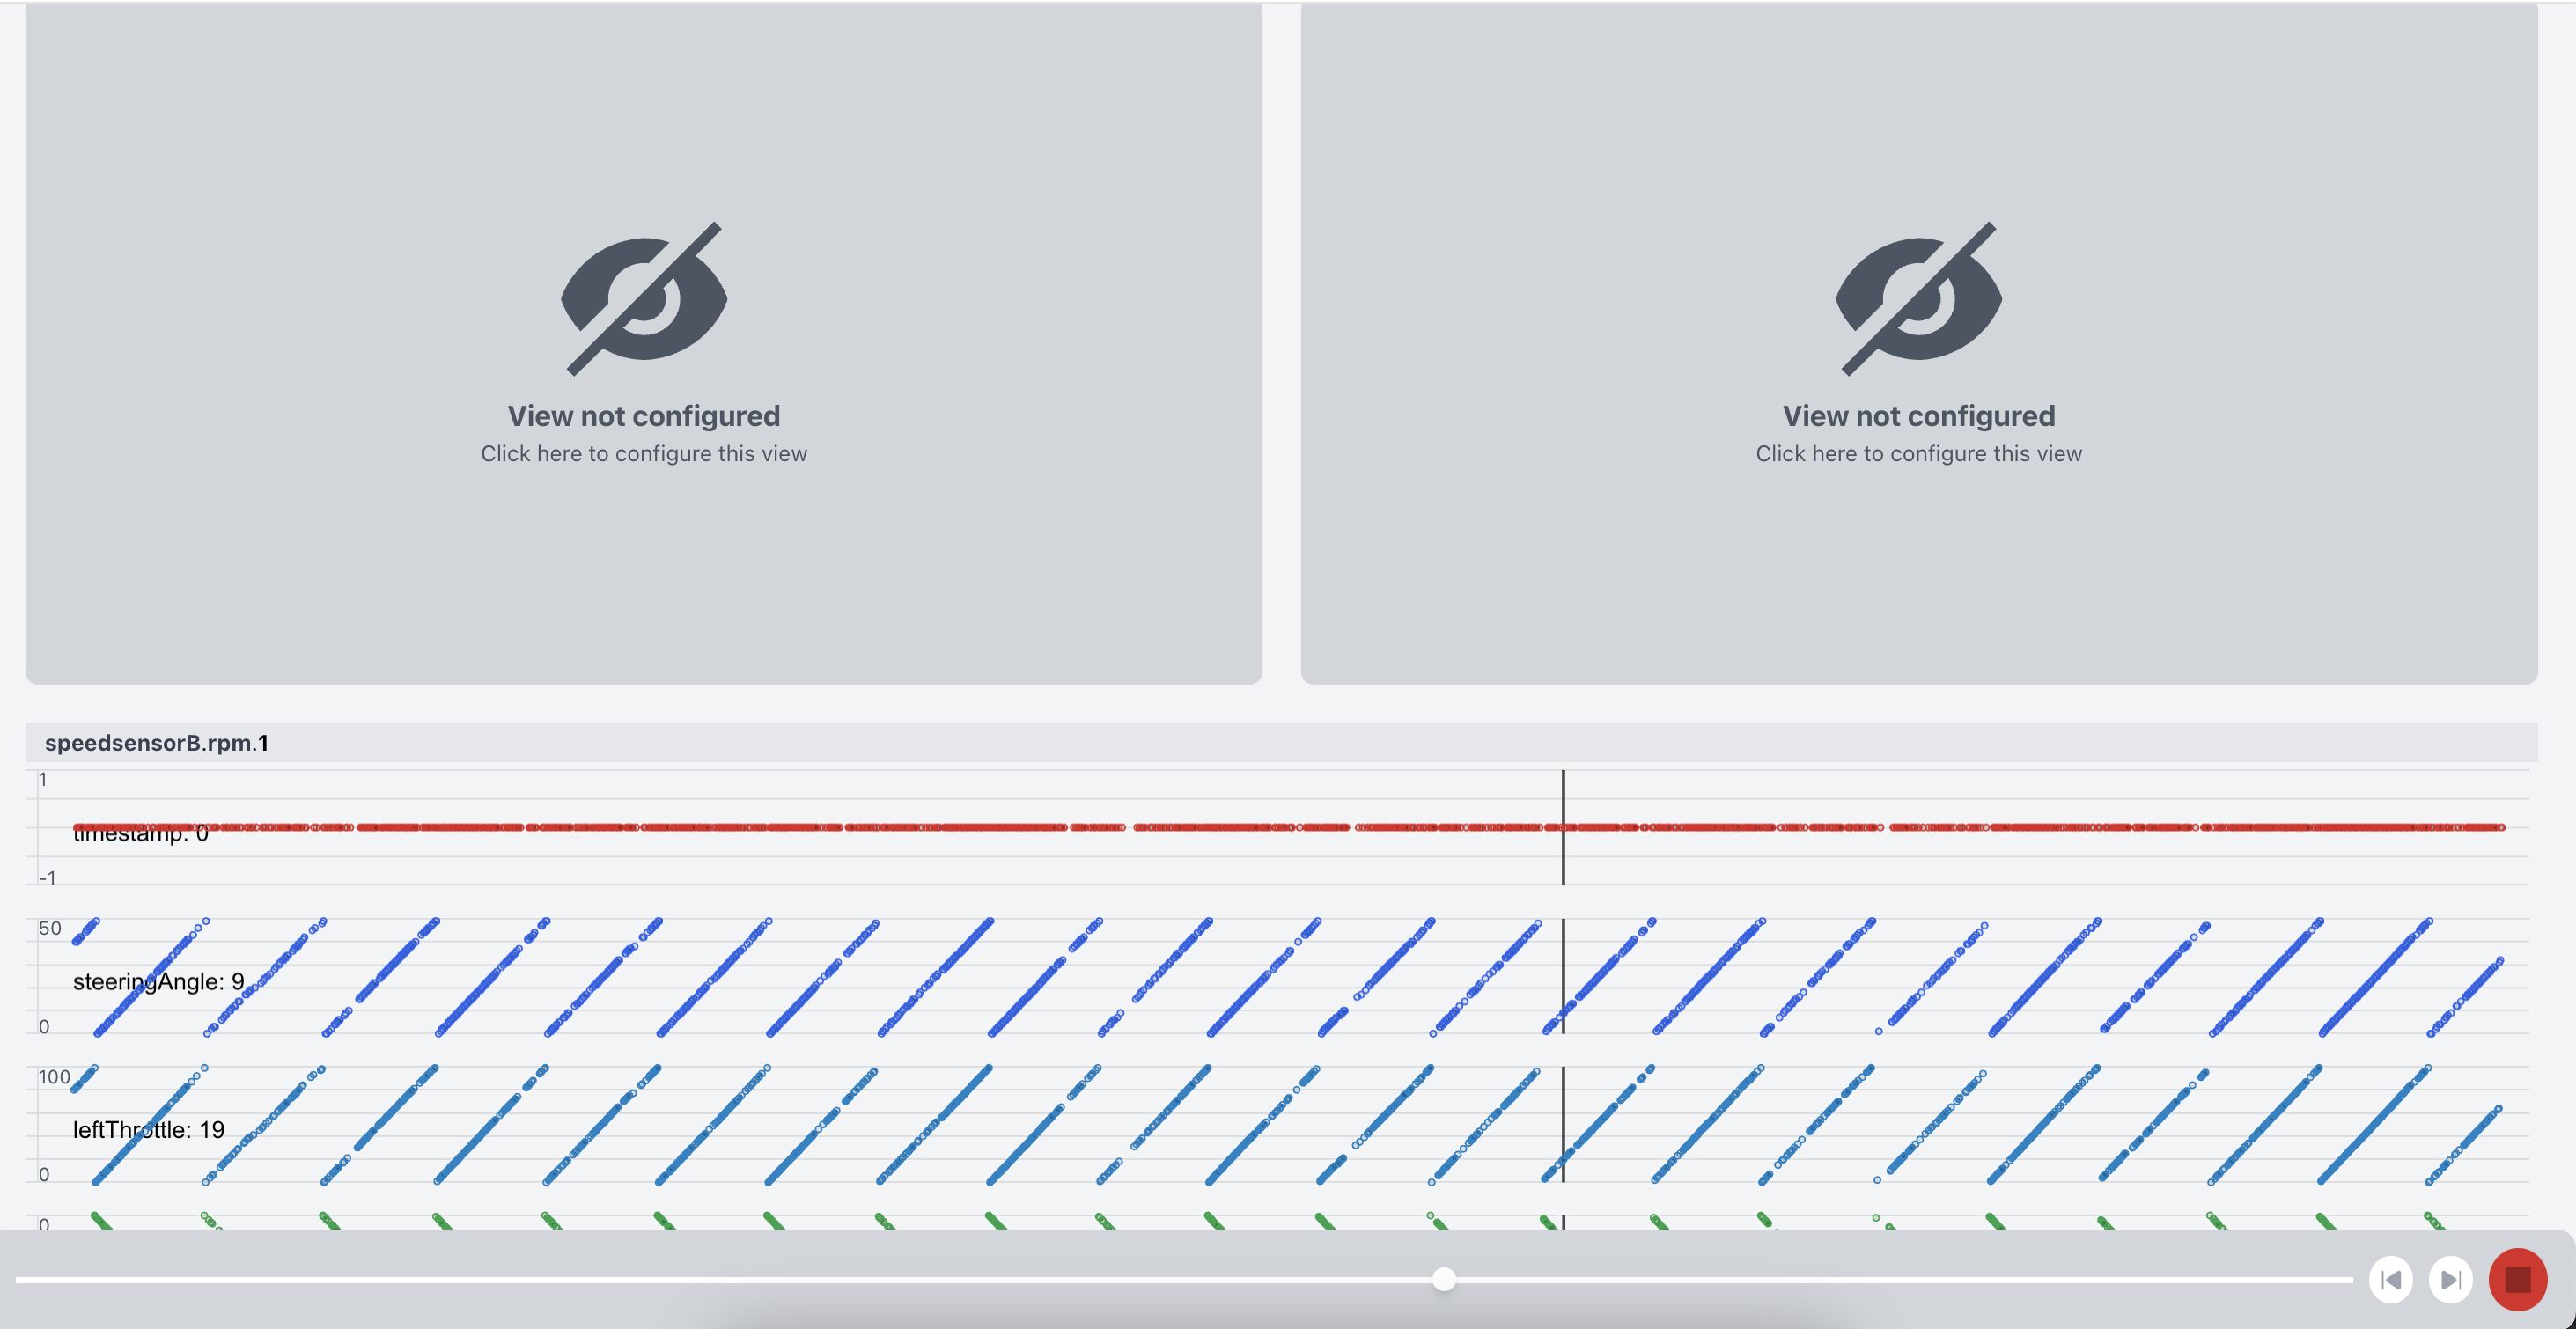
With the red button on the bottom right, you can pause incoming data (this is useful when you want to reconstruct a specific moment in time, for example a crash). You can scrub through frames using the bottom scrollbar:
If you have camera sensors running on the debix, you can on one of the top two views to configure the camera feeds to display:
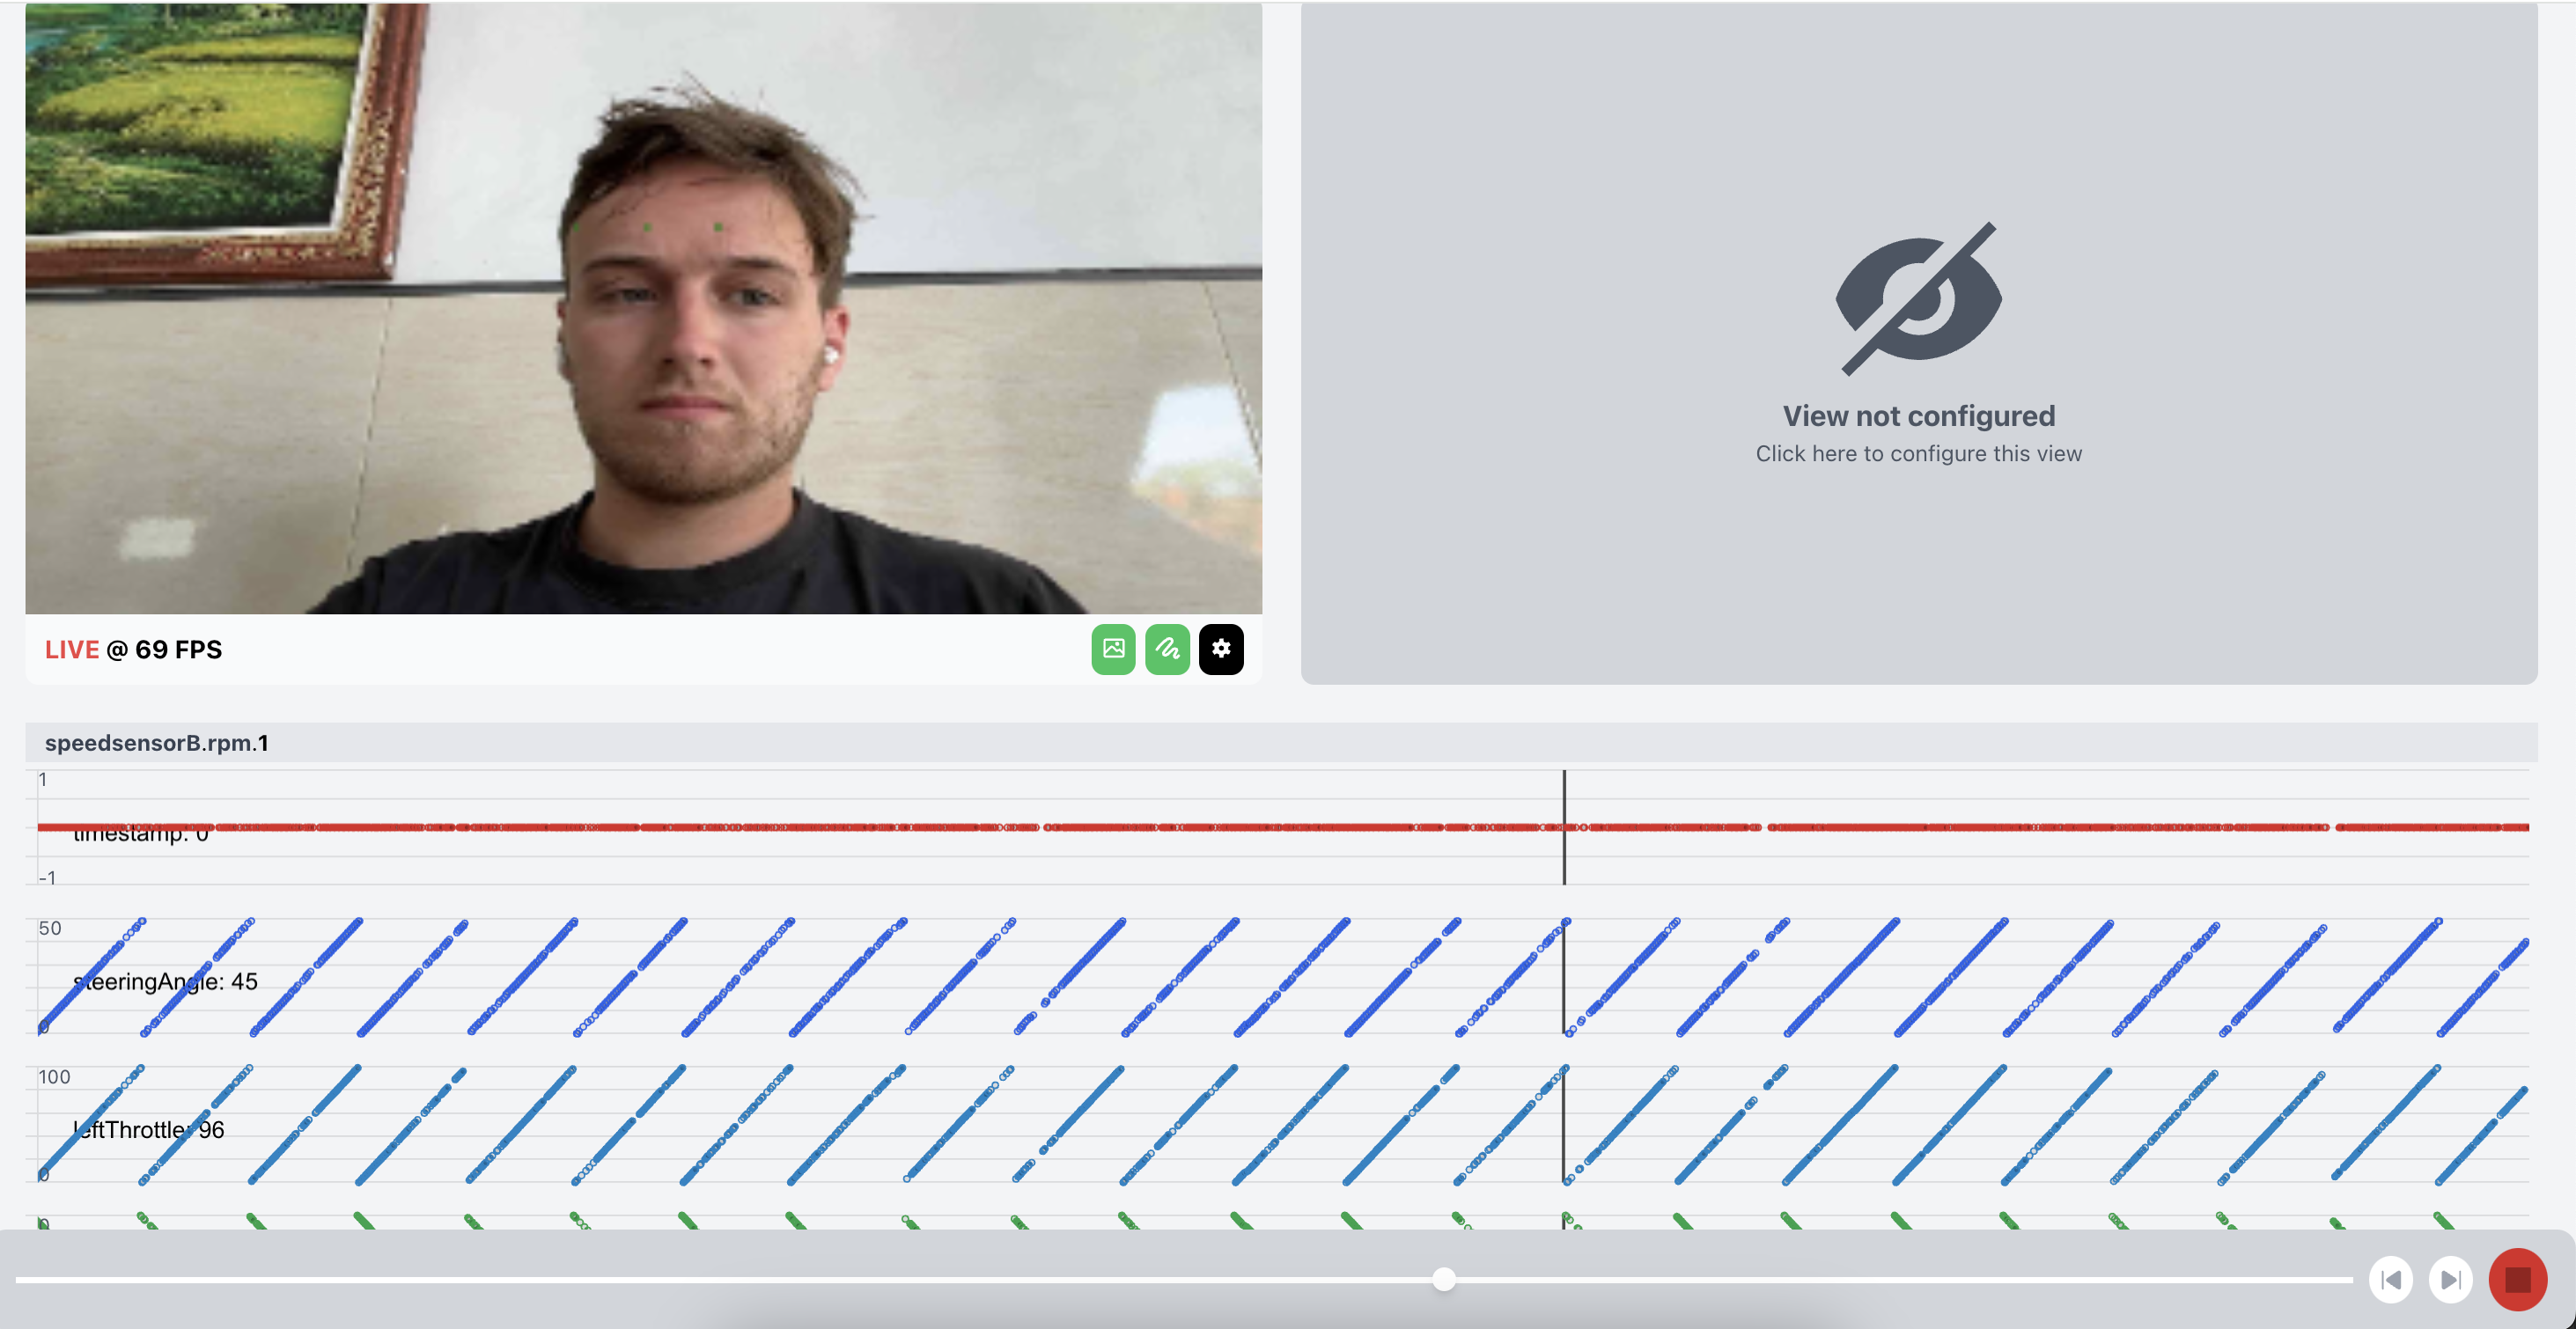
If camera streaming consumes to much bandwidth, you can opt for "canvas-only" streaming. Which will allow you to draw basic figures on a canvas to only highlight important points, instead of sending a full image.
In the top navigation bar, you will also find the "services" button. When you press this button, you will get the entire dependency graph (visualized in realtime).
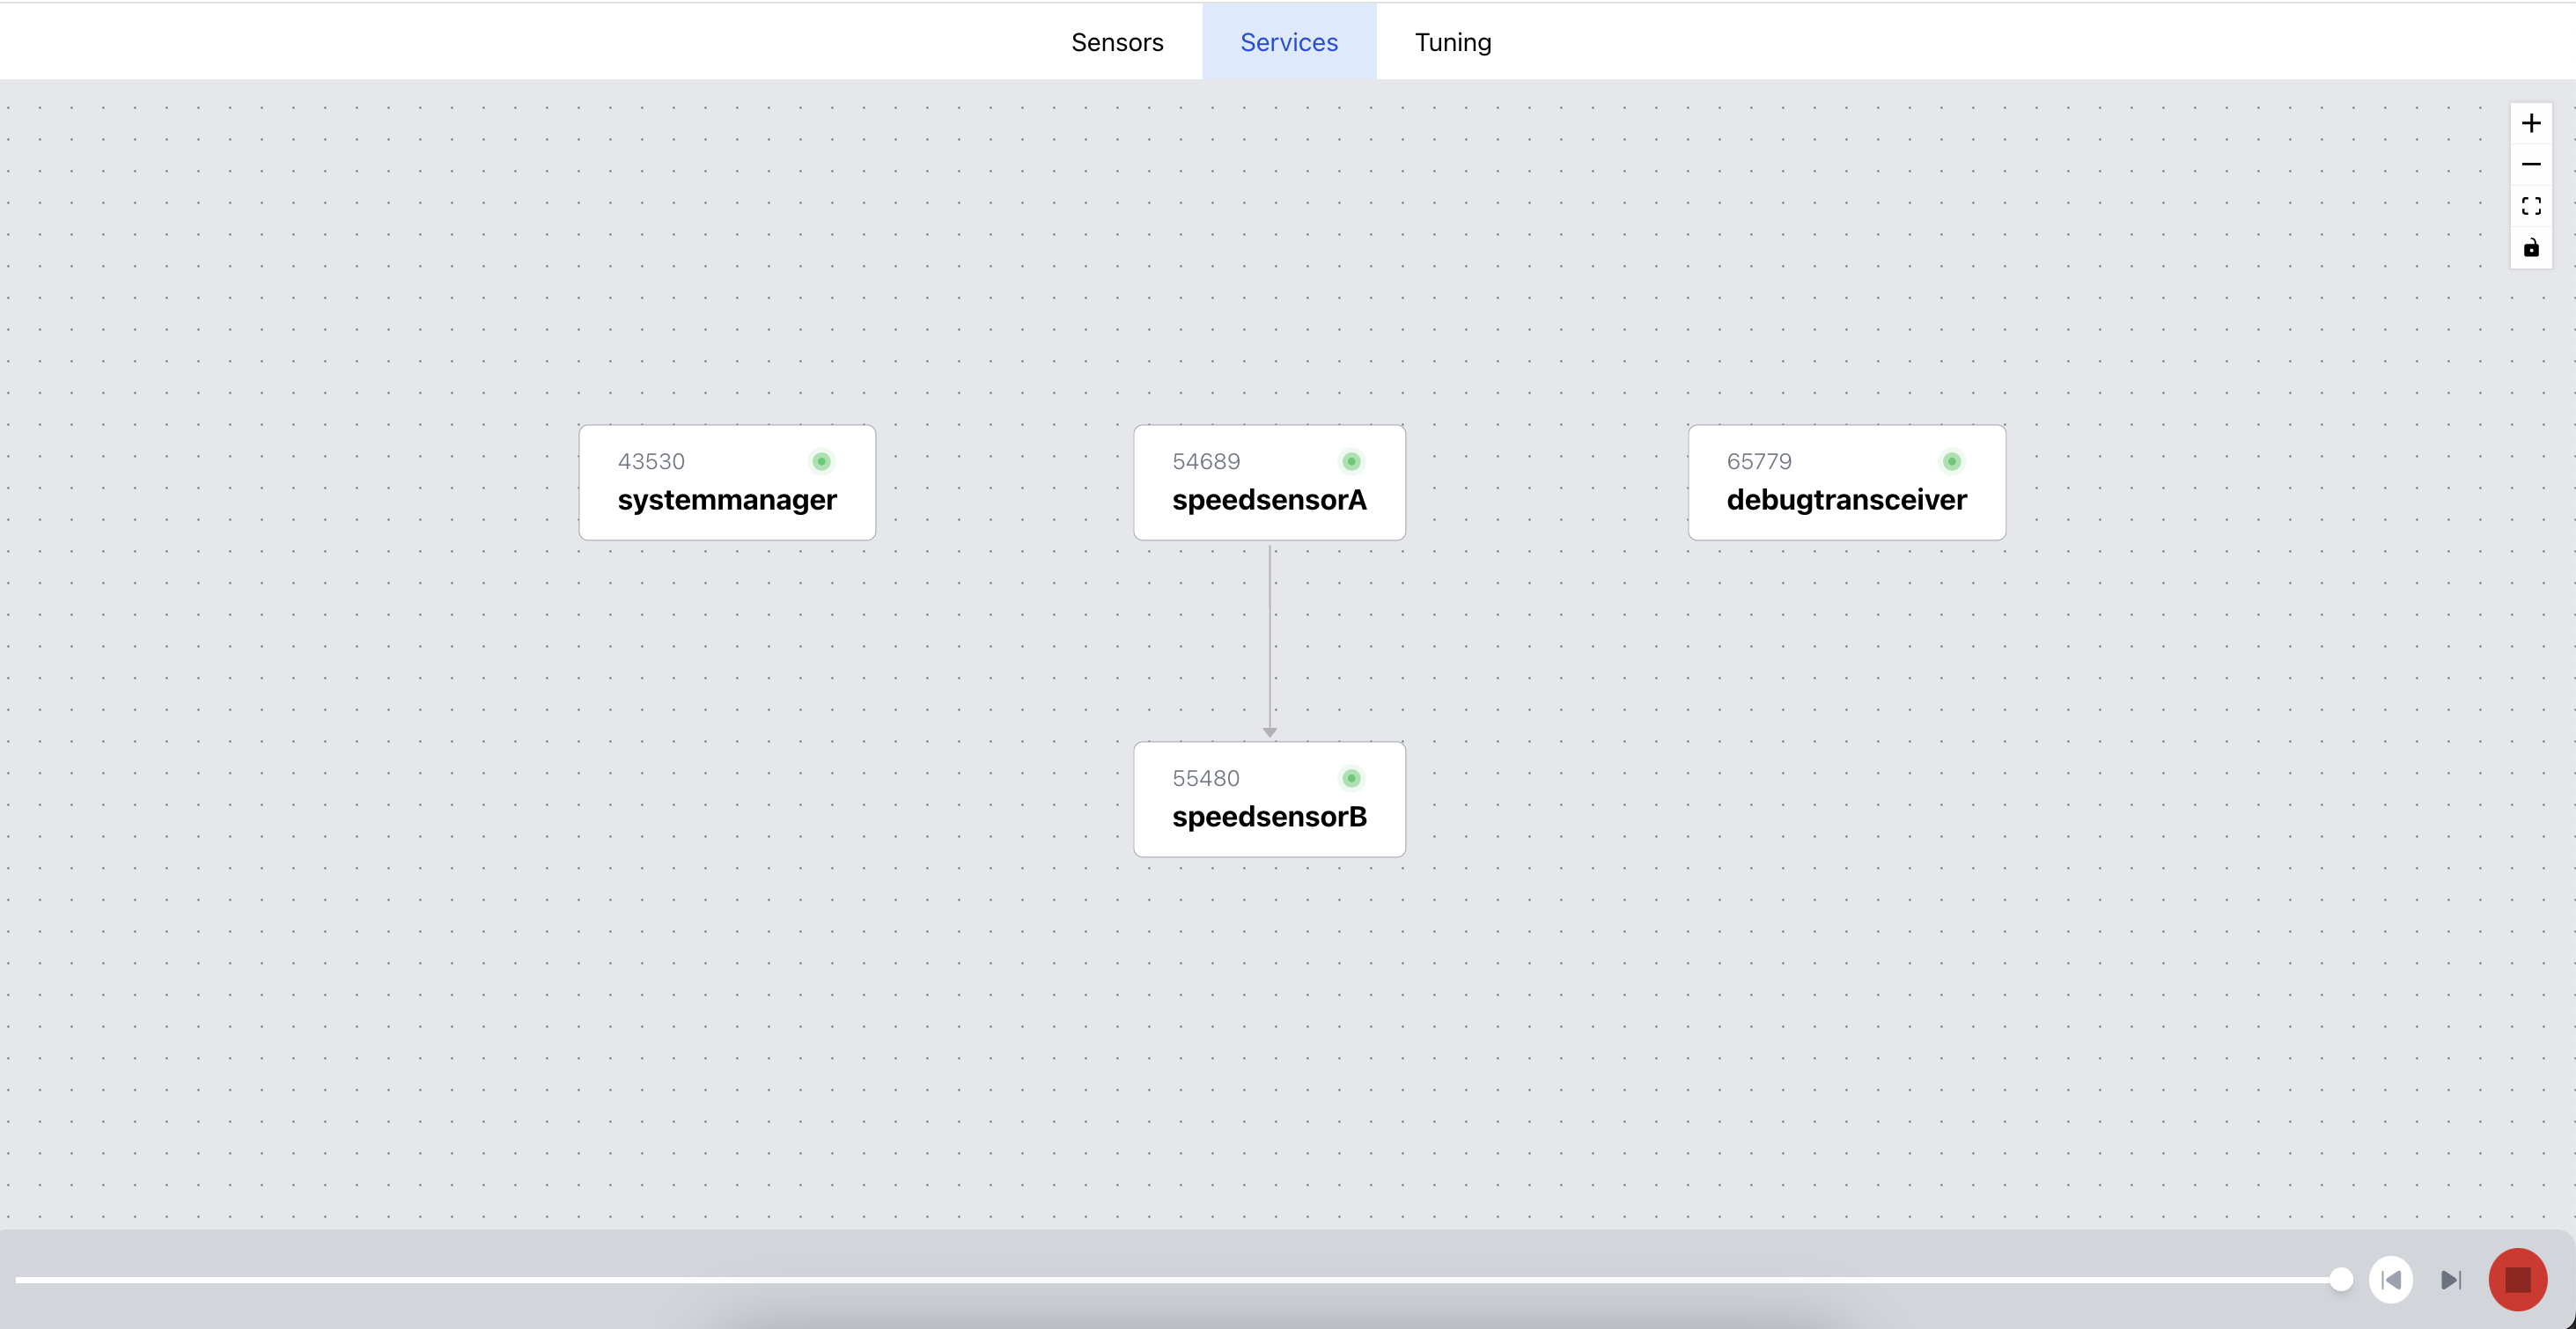
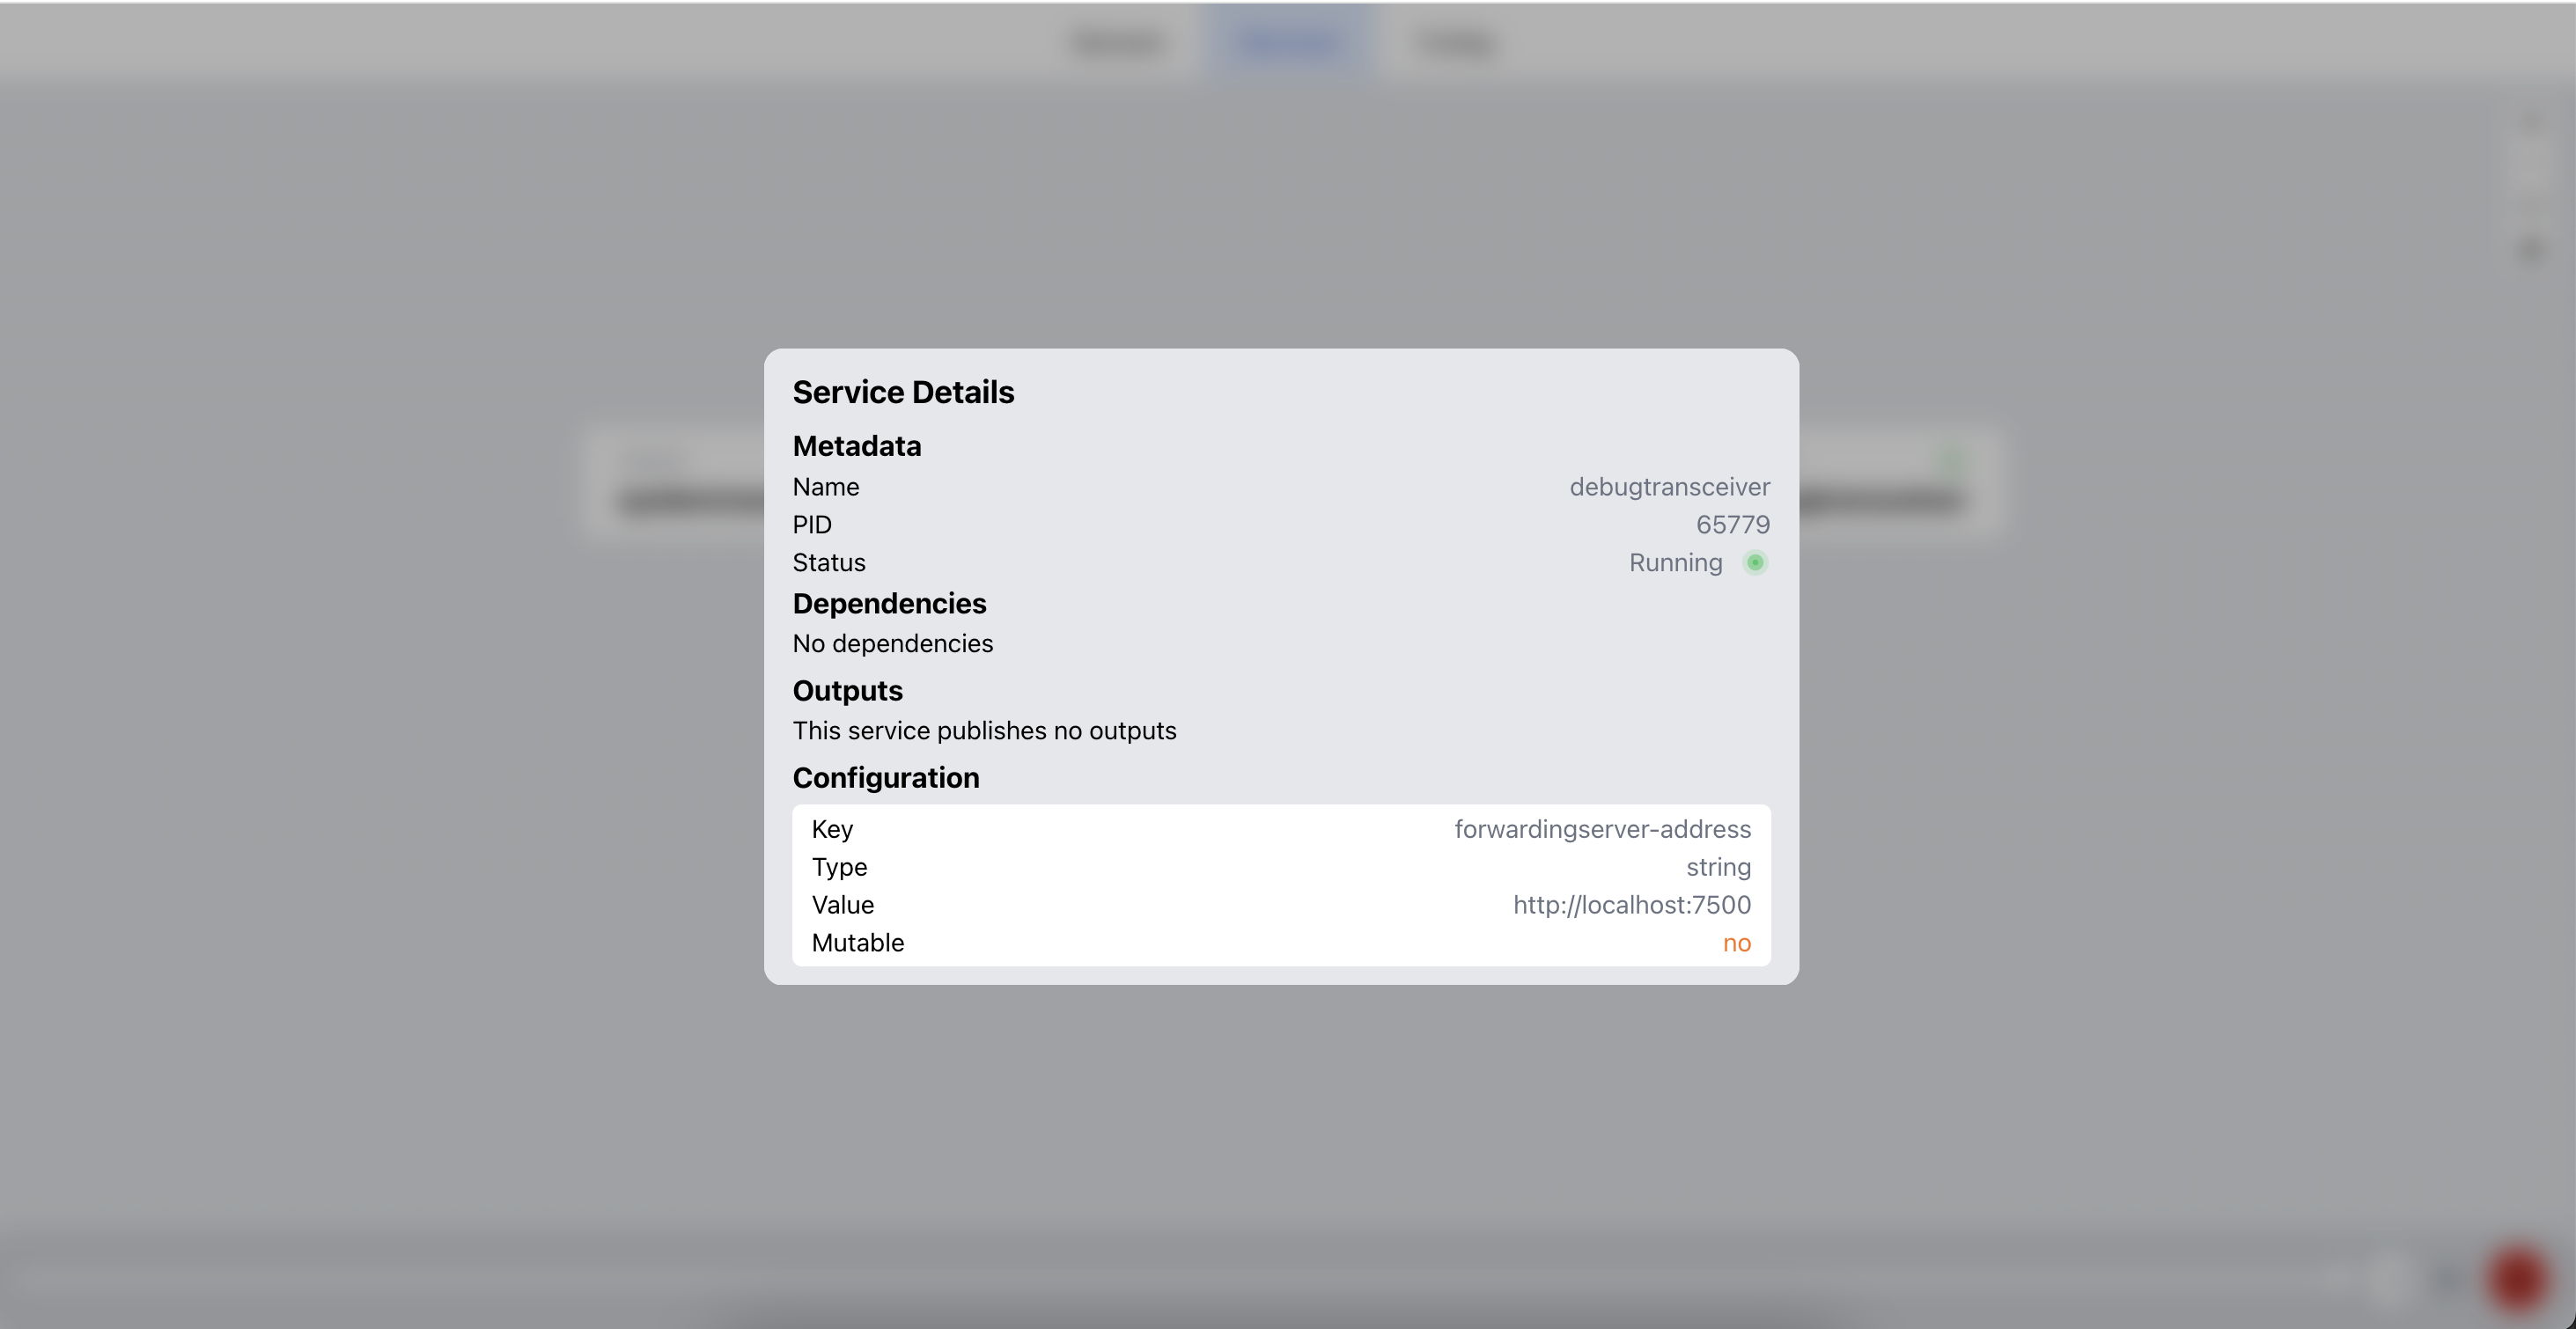
Notice how you can see all services running on the debix, and the dependencies between them. Service names and PIDs are highlighted and if you double click on a service, you can find detailled information, such as the example shown below:
Hopefully, debugging like this will help you quickly understand the problems your software encounters when put "in the real world". Naturally, the ASE software stack does not (aim to) replace more low-level debuggers for example used to inspect memory, view variable values and alter execution (such as GDB for C), but it will help you understanding your pipeline and tuning your software. Also keep in mind that multiple clients can connect to the ForwardingServer, so that you and your teammates can individually debug your software stack.