Debug a Pipeline
Starting a pipeline is one thing, but the ASE framework provides many more features, such as enabling debug mode to better understand how services communicate. In this tutorial, you will see how this works in the basic autonomous driving pipeline.

Elias Groot
Founding Member, Ex-Software Lead and Ex-Project Administrator
Prerequisites
- You are connected to the ASE network
- You have
roverctland Docker installed - The Rover is powered on and put on NXP cup tracks
- The Rover is calibrated
- The Basic Autonomous Driving pipeline is installed on the Rover
Start roverctl-web in Debug Mode
In order to debug a pipeline, roverctl-web must be started in debug mode using the --debug flag. If you have a roverctl-web process open already, you must close this first.
# Open roverctl-web in debug mode for Rover 12
roverctl --debug --rover 12
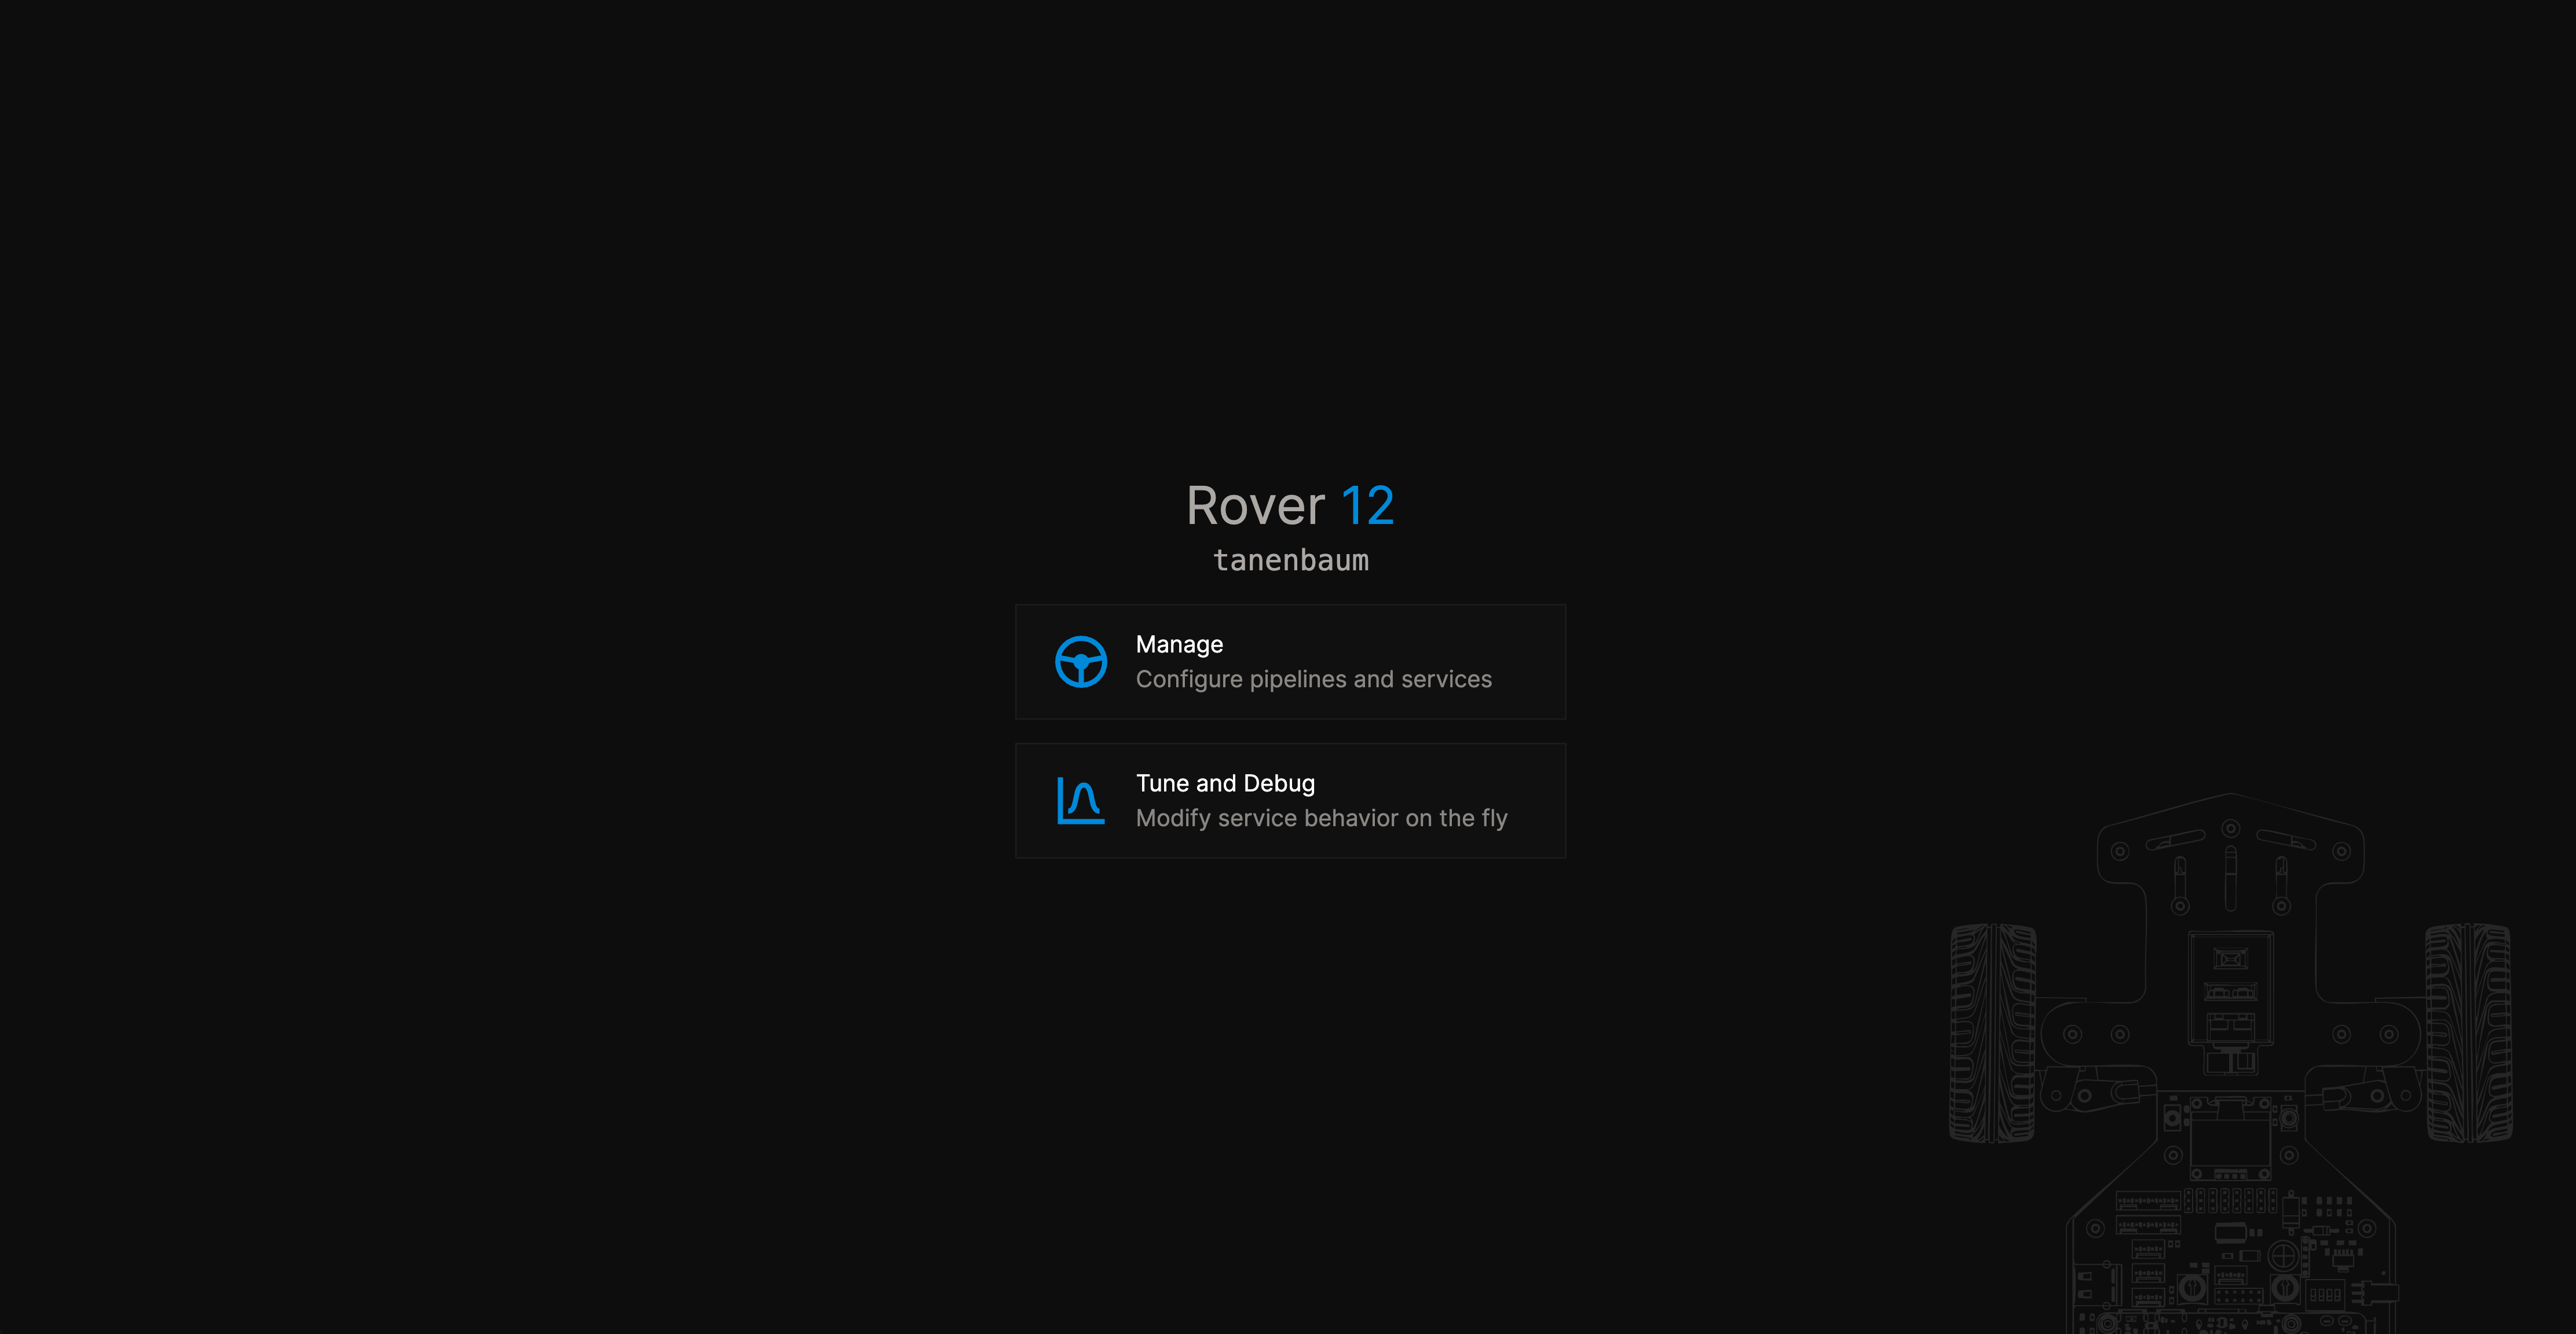
When opened in debug mode, the tune and debug page will be available:

Set Up Your Pipeline
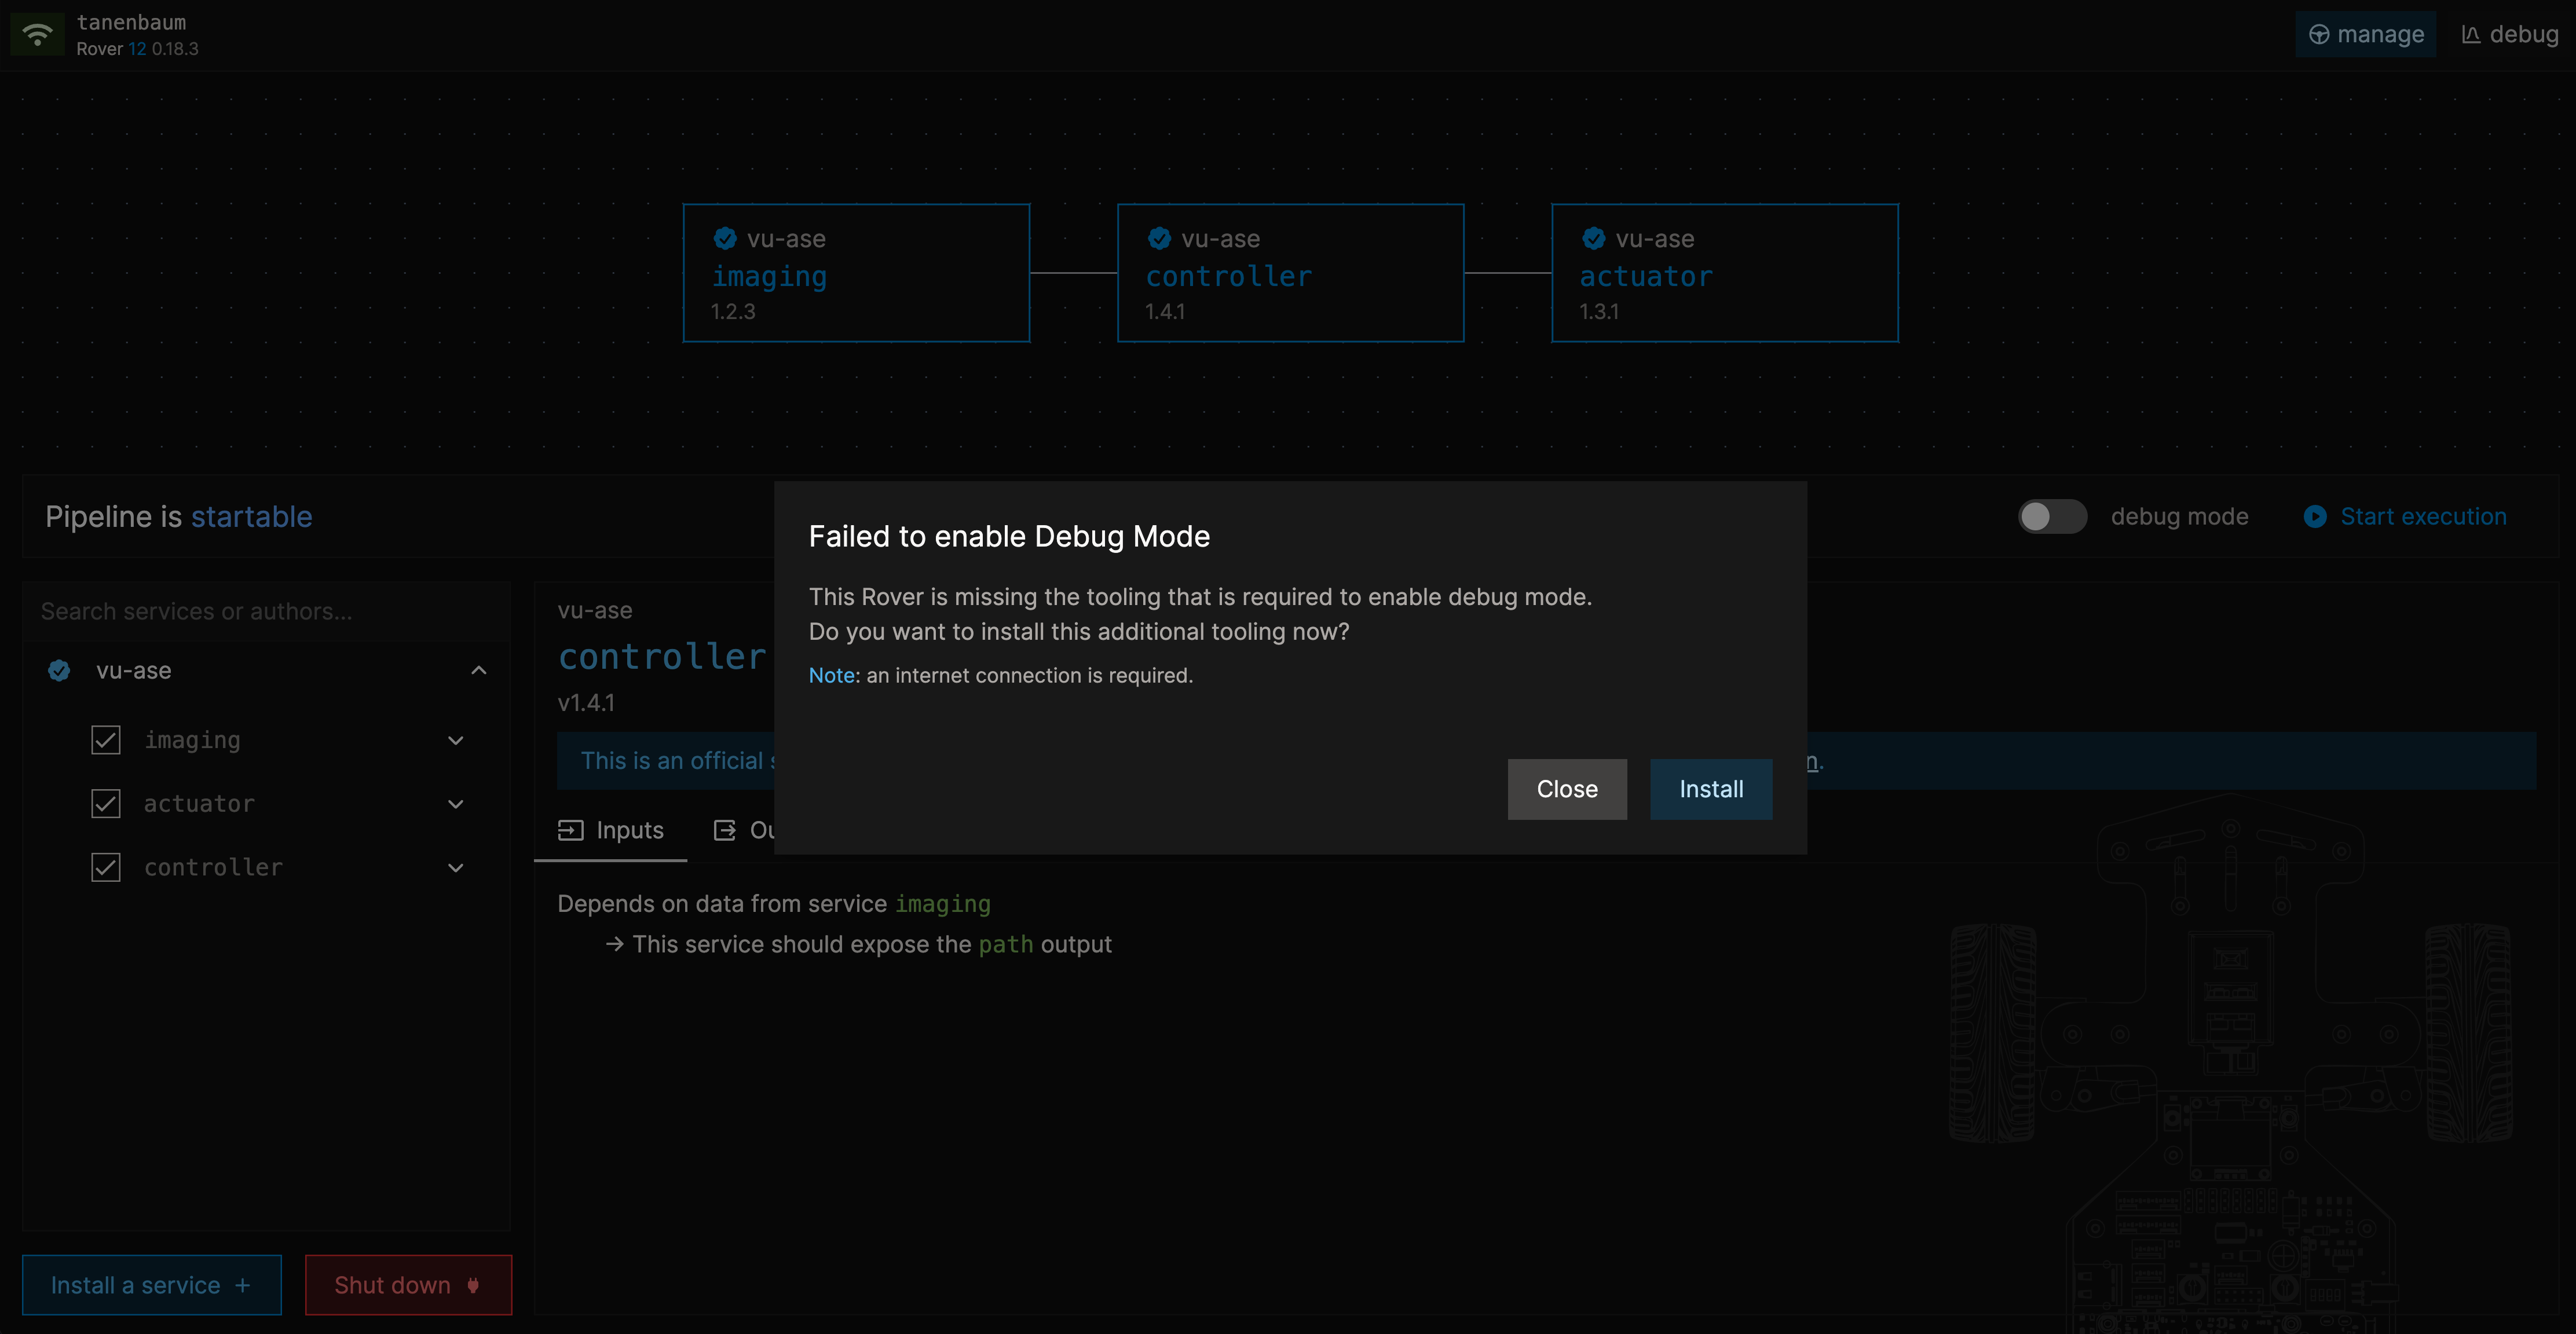
Enable the basic autonomous driving pipeline ("imaging", "controller" and "actuator") again on the manage page. Additionally, press the "debug mode" toggle left to the "start execution" button. You will be prompted with an installation screen.

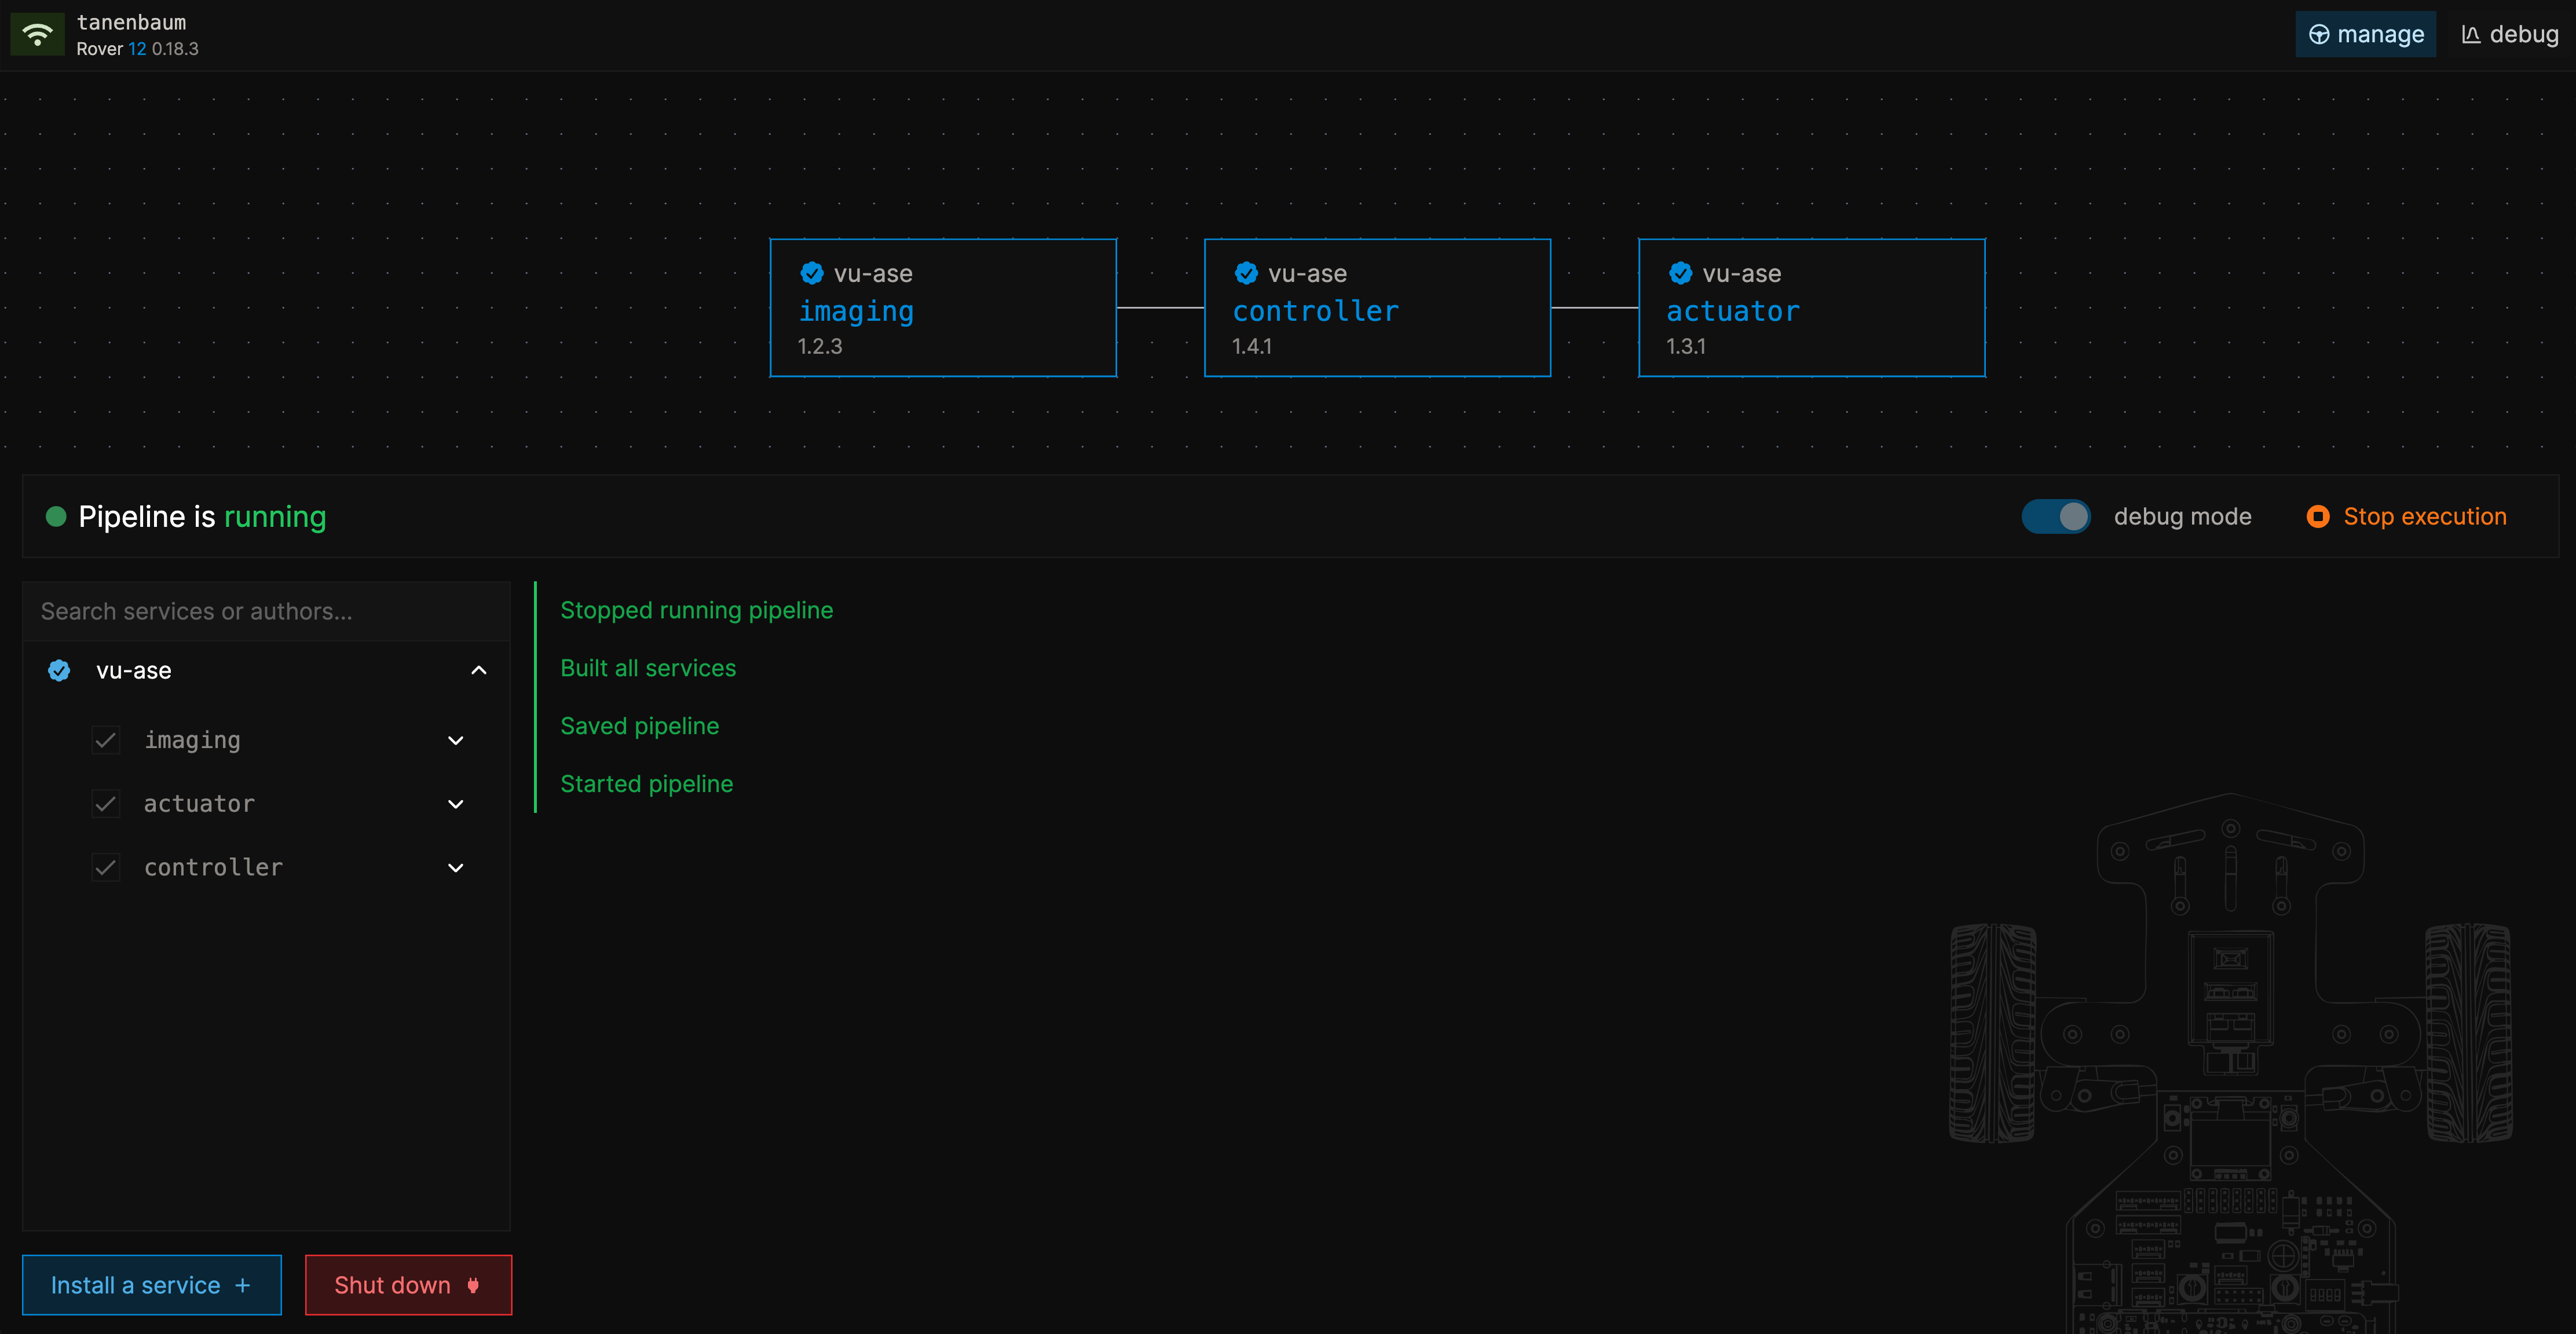
Press "install" and wait for the installation to finish. Then, with the debug mode toggle enabled, press "start execution".

View Debugging Information
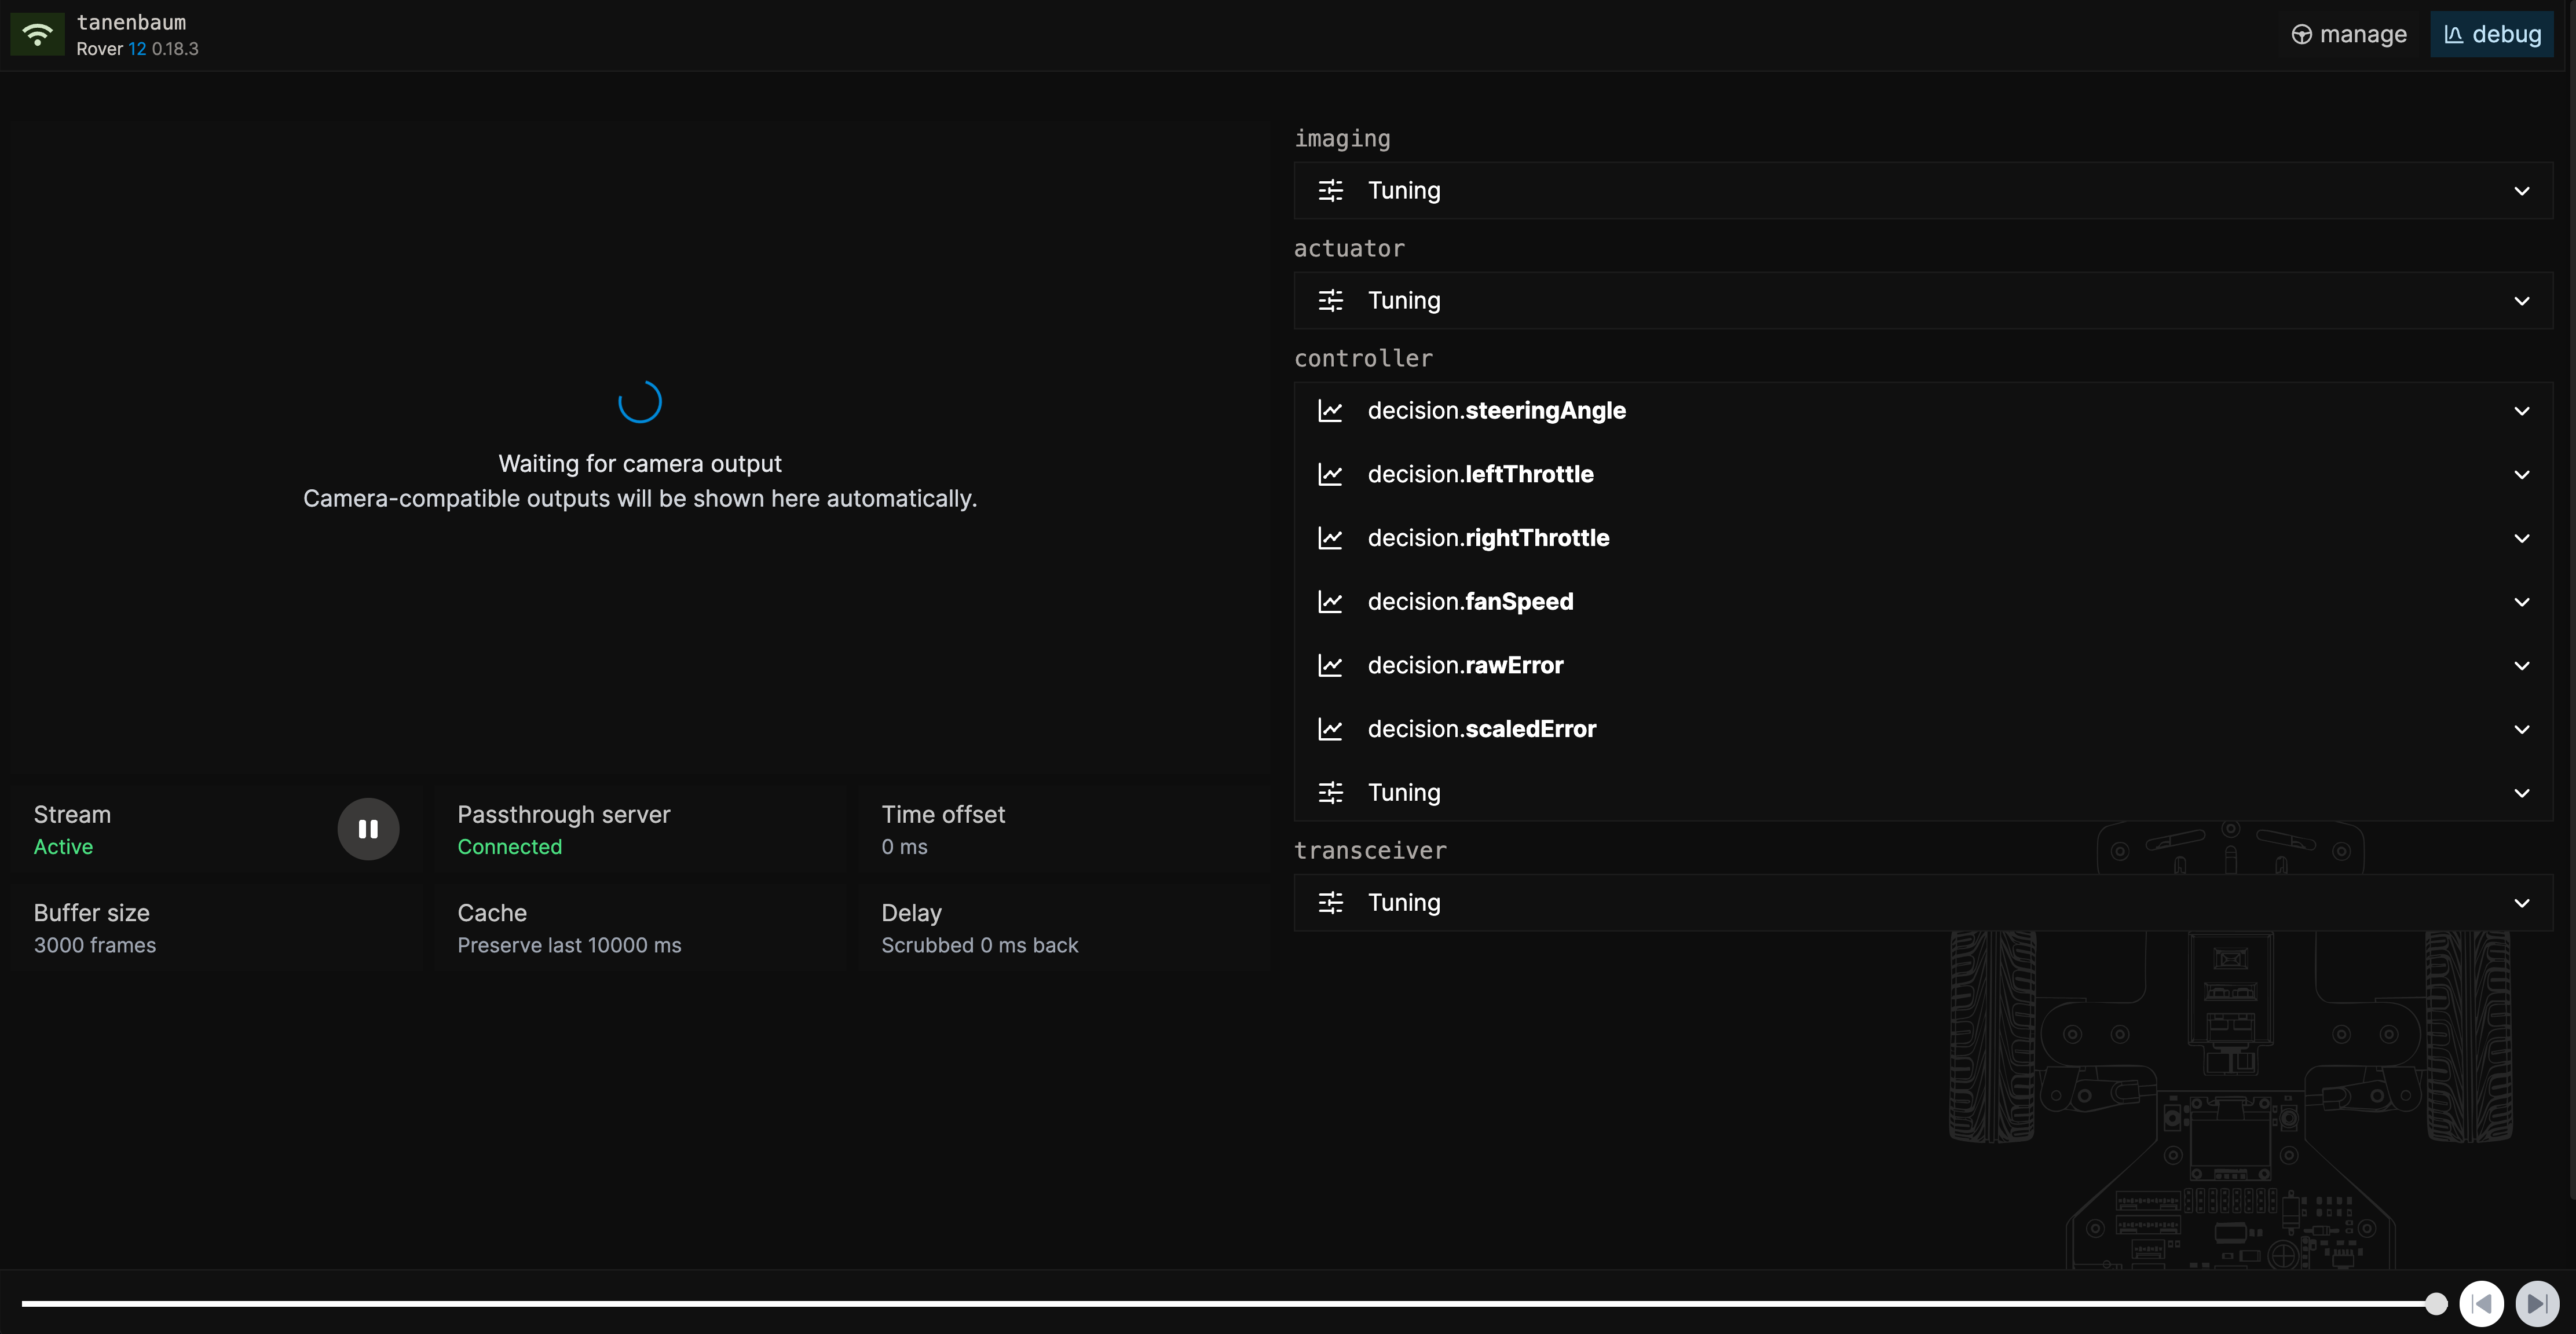
Head over to the debug page using the navigation bar and find that all services in the pipeline are shown here. The camera data will be live-streamed and you can view individual data streams from each service.

Try pausing the live-stream, playing back frames and understanding what data is being outputted. By capturing all output data from all services, you can get very fine-grained insights in how services interact with each other. Notice that you can swap and replace services if you want to test different implementations or build different pipelines.